Documentation
Table 1:
General properties of the young stellar clusters.
| Name |
References |
Age |
Massive? |
Expanding? |
distance |
Σ2pc |
Σ20pc |
| ... |
... |
[Myr] |
(y/n) |
(y/n) |
[pc] |
[×10-2arcmin-2] |
[×10-2arcmin-2] |
| NGC 1333 |
[1,2,3,4,5,6] |
0-2 |
n |
n |
291±7 |
1.6 |
0.052 |
| IC 348 |
[1,2,3,4,5,6,7,8] |
0-5 |
n |
n |
314±8 |
5.4 |
0.12 |
| NGC 1893 |
[6] |
1-2 |
n |
y |
2814±302 |
80 |
5.9 |
| λ Ori |
[1,2,4,5,6] |
1-11 |
n |
|
393±8 |
6.2 |
0.37 |
| NGC 1960 |
[7] |
15-39†1 |
n |
|
1131±37 |
100 |
2.4 |
| NGC 2169 |
[8] |
6-12 |
n |
|
943±43 |
17 |
0.67 |
| NGC 2244 |
[1,3,4,6] |
0-4 |
y |
y |
1414±85 |
57 |
6.8 |
| NGC 2264 |
[1,2,4,6,7] |
0-6 |
n |
n |
711±32 |
31 |
1.0 |
| NGC 2353 |
[8] |
8-16 |
n |
|
1187±122 |
80 |
4.8 |
| NGC 2362 |
[1,2,3,4,6,7,8] |
0-6 |
y |
n |
1271±88 |
110 |
5.8 |
| γ Vel |
[|,2,4,6] |
0-16 |
n |
|
359±19 |
9.7 |
0.80 |
| ASCC 58 |
[8] |
7-13* |
n |
|
470±15 |
3.5 |
0.35 |
| Tr 15 |
[4] |
4-12 |
y?†2 |
y? |
2358±261 |
440 |
40 |
| NGC 6231 |
[6,8] |
1-9 |
y |
n |
1588±115 |
230 |
15 |
| NGC 6531 |
[8] |
5-10 |
n |
|
1214±68 |
96 |
7.4 |
| NGC 6611 |
[4,6] |
1-4 |
y |
y |
1602±126 |
150 |
16 |
| Tr 37 |
[1,2,3,4,6] |
0-6 |
y†3 |
|
914±32 |
31 |
2.3 |
| NGC 7129 |
[1,2,3,4,6] |
0-6 |
n |
|
915±56 |
12 |
0.38 |
| NGC 7160 |
[1,2,3,4,8] |
8-15 |
n |
n |
920±48 |
17 |
1.2 |
|
Notes:
Column 2 lists disk dissipation studies where the clusters in Col. 1 were included. The
numbers in Cols 3 and 4 are based on such studies and references therein. The age range is indicated
in Col. 3.
Following Mamajek (2009)
an uncertainty of 30% has been assigned to ages without errorbars.
Column 4 indicates whether the cluster has a total stellar mass above or below 500-1000M⊙ (yes or
not), which is in turn indicative of the presence of a significant number of massive OB stars within
the clusters (note, however, that most are part of OB associations when larger scales are considered
(Wright 2020).
The presence or absence of evidence indicating cluster expansion (yes or not) is indicated
in Col. 5, whenever available in Kuhn (2019).
The last three columns are based on our work. The average
Gaia EDR3 distance (and standard deviation) to each cluster is shown in Col. 6.
Columns 7 and 8 show the surface density of member stars for the inner FOV2pc and the whole
FOV20pc.
References:
[1]: Hernández et al. (2008),
[2]: Mamajek (2009),
[3]: Muzerolle et al. (2010)
[4]: Pfalzner et al. (2014),
[5]: Ribas et al. (2015),
[6]: Guarcello et al. (2021),
[7]: Haisch et al. (2001),
[8]: Fedele et al. (2010).
†1: Panja et al. (2021).
†2: Wang et al. (2011).
†3: Saurin et al. (2012).
|
Table 2:
Class II inner disk fractions from 2MASS color-color diagrams.
| |
FOV20pc |
FOV2pc |
| Name |
NJHK/Nmemb |
fdiskJHK |
N
JHK/Nmemb (p0) |
fdiskJHK (p
0) |
NJHK/Nmemb |
fdiskJHK |
N
JHK/Nmemb (p0) |
fdiskJHK (p
0) |
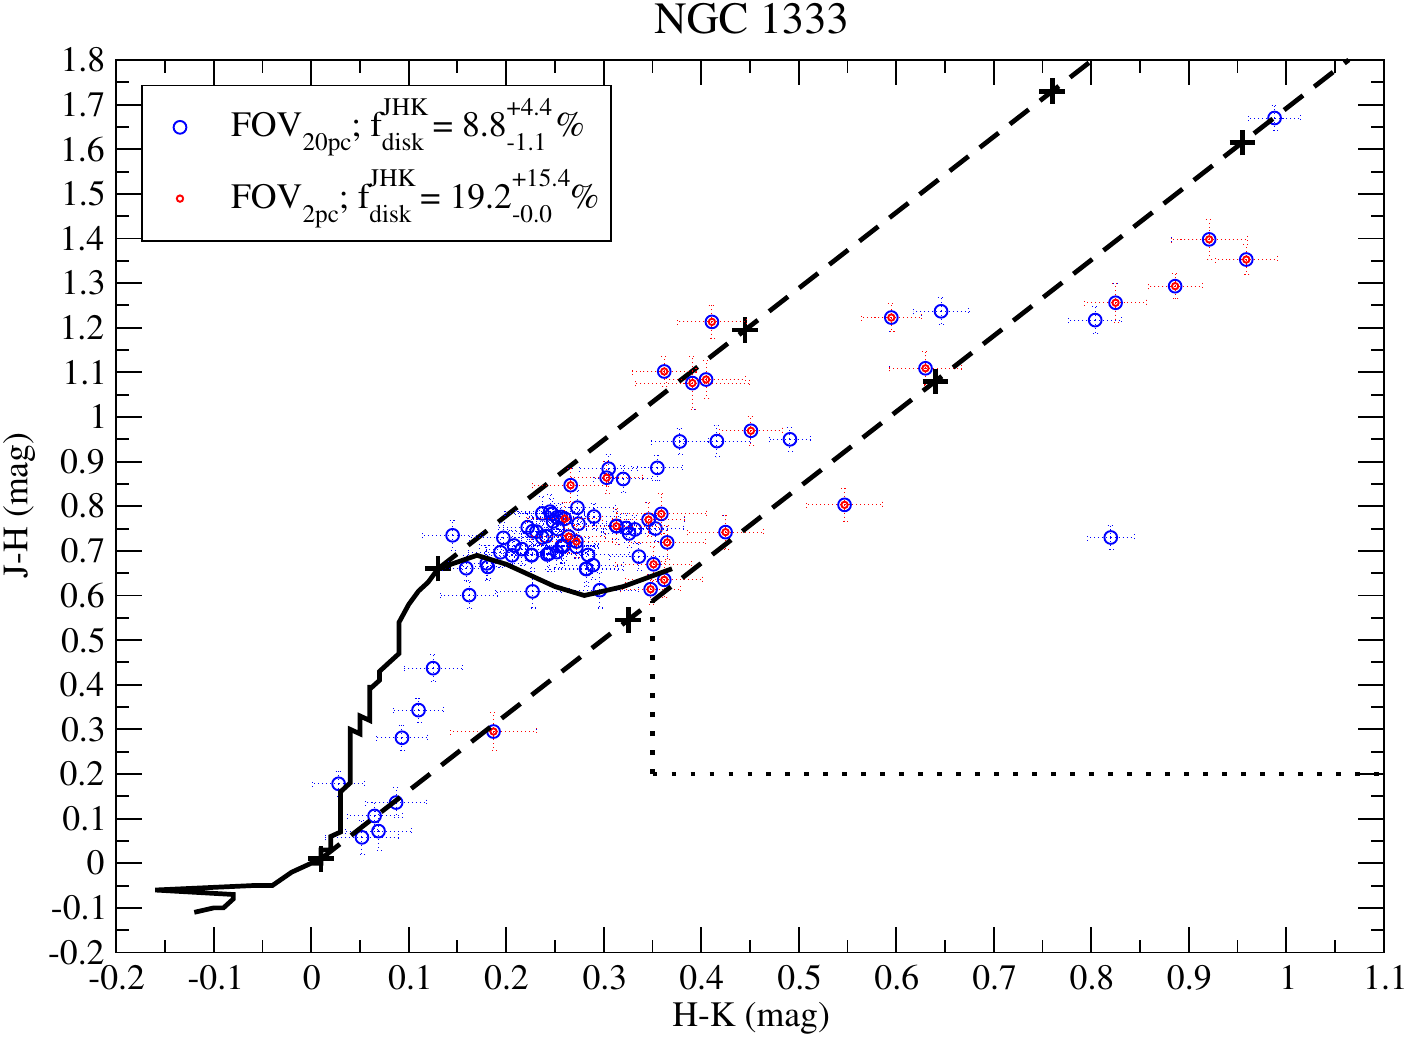
| NGC 1333 |
91/95 |
8.8-1.1+4.4 |
85/88 (0.2) |
9.4
-1.2+3.5 (0.2) |
26/28 |
19.2
-0.0+15.4 |
26/28 (0.2) |
19.2
-0.0+15.4 (0.2) |
| IC 348 |
205/209 |
2.4-0.0+0.5 |
148/151 (0.6) |
0.7
-0.0+0.7 (0.6) |
95/97 |
2.1
-0.0+0.0 |
81/83 (0.6) |
2.5
-0.0+0.0 (0.6) |
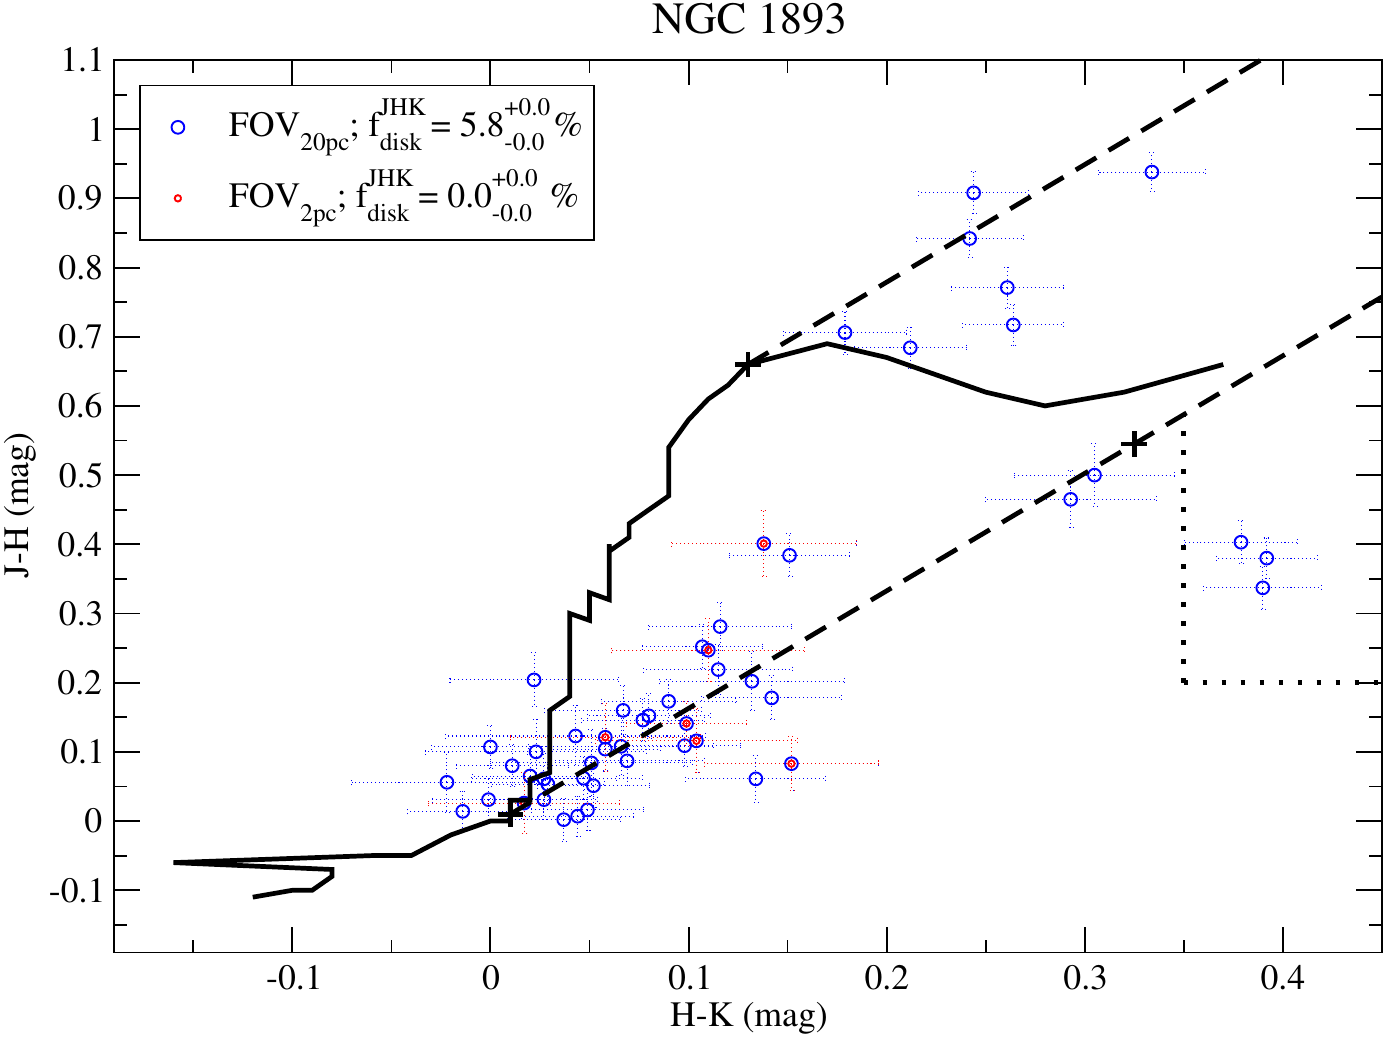
| NGC 1893 |
52/59 |
5.8-0.00.0 |
52/59 (0.5)† |
5.8
-0.0+0.0 (0.5)† |
7/8 |
0.0
-0.0+0.0 |
7/8 (0.5)† |
0.0
-0.0+0.0 (0.5)† |
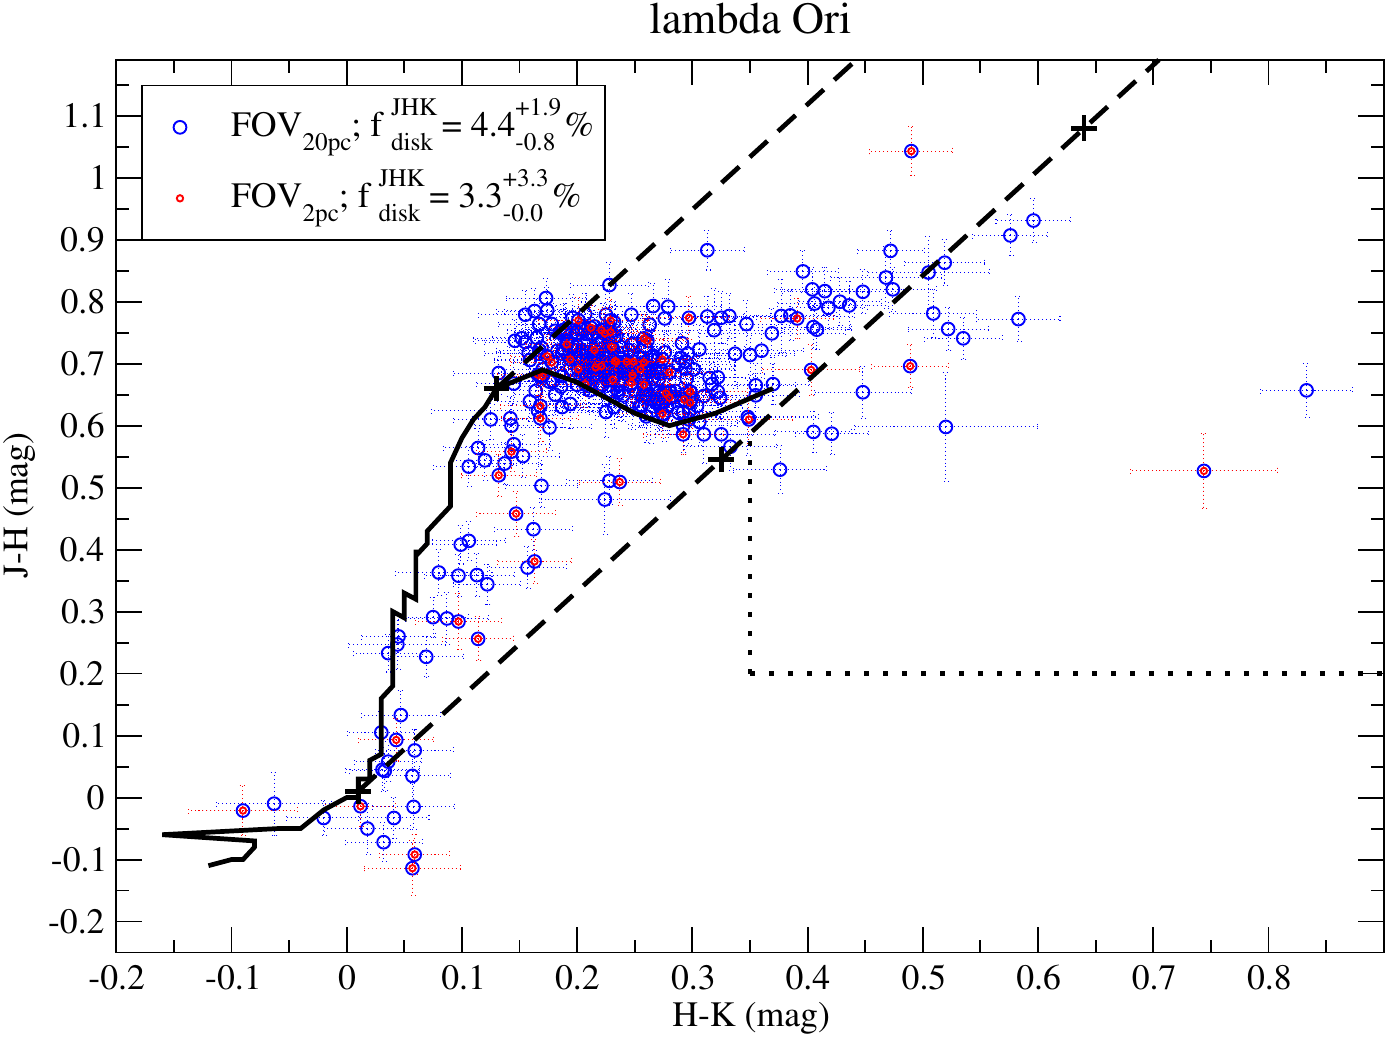
| λ Ori |
366/377 |
4.4-0.8+1.9 |
31/31 (0.9) |
12.9
-0.0+0.0 (0.9) |
61/63 |
3.3
-0.0+3.3 |
16/16 (0.9) |
12.5
-0.0+0.0 (0.9) |
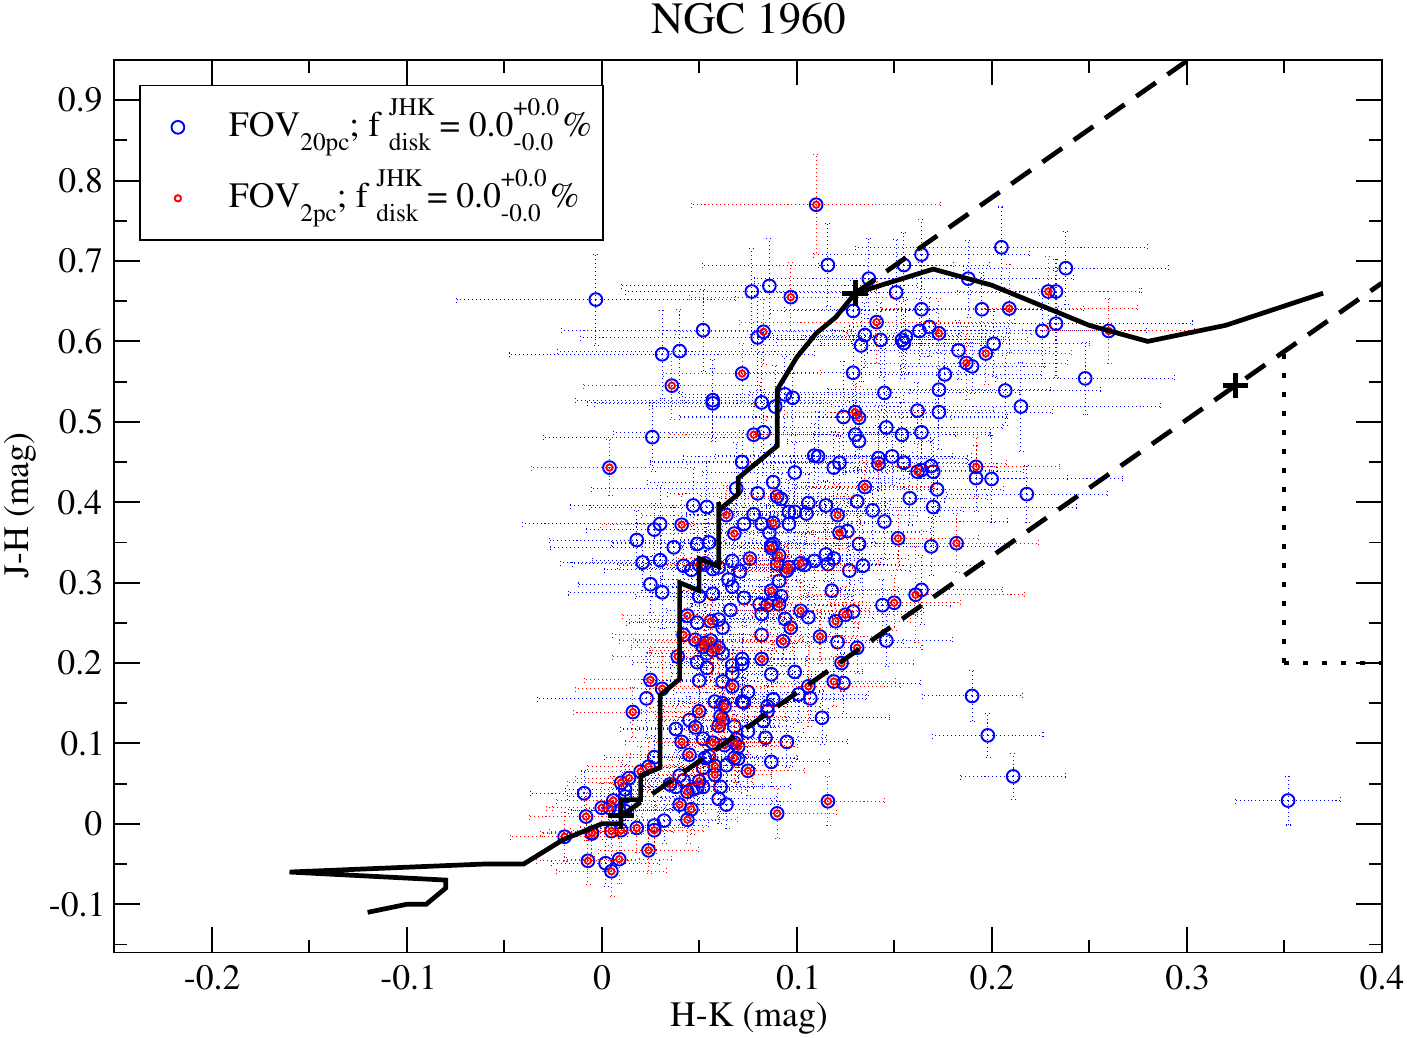
| NGC 1960 |
265/273 |
0.0-0.0+0.0 |
243/250 (0.8) |
0.0
-0.0+0.0 (0.8) |
109/114 |
0.0
-0.0+0.0 |
106/110 (0.8) |
0.0
-0.0+0.0 (0.8) |
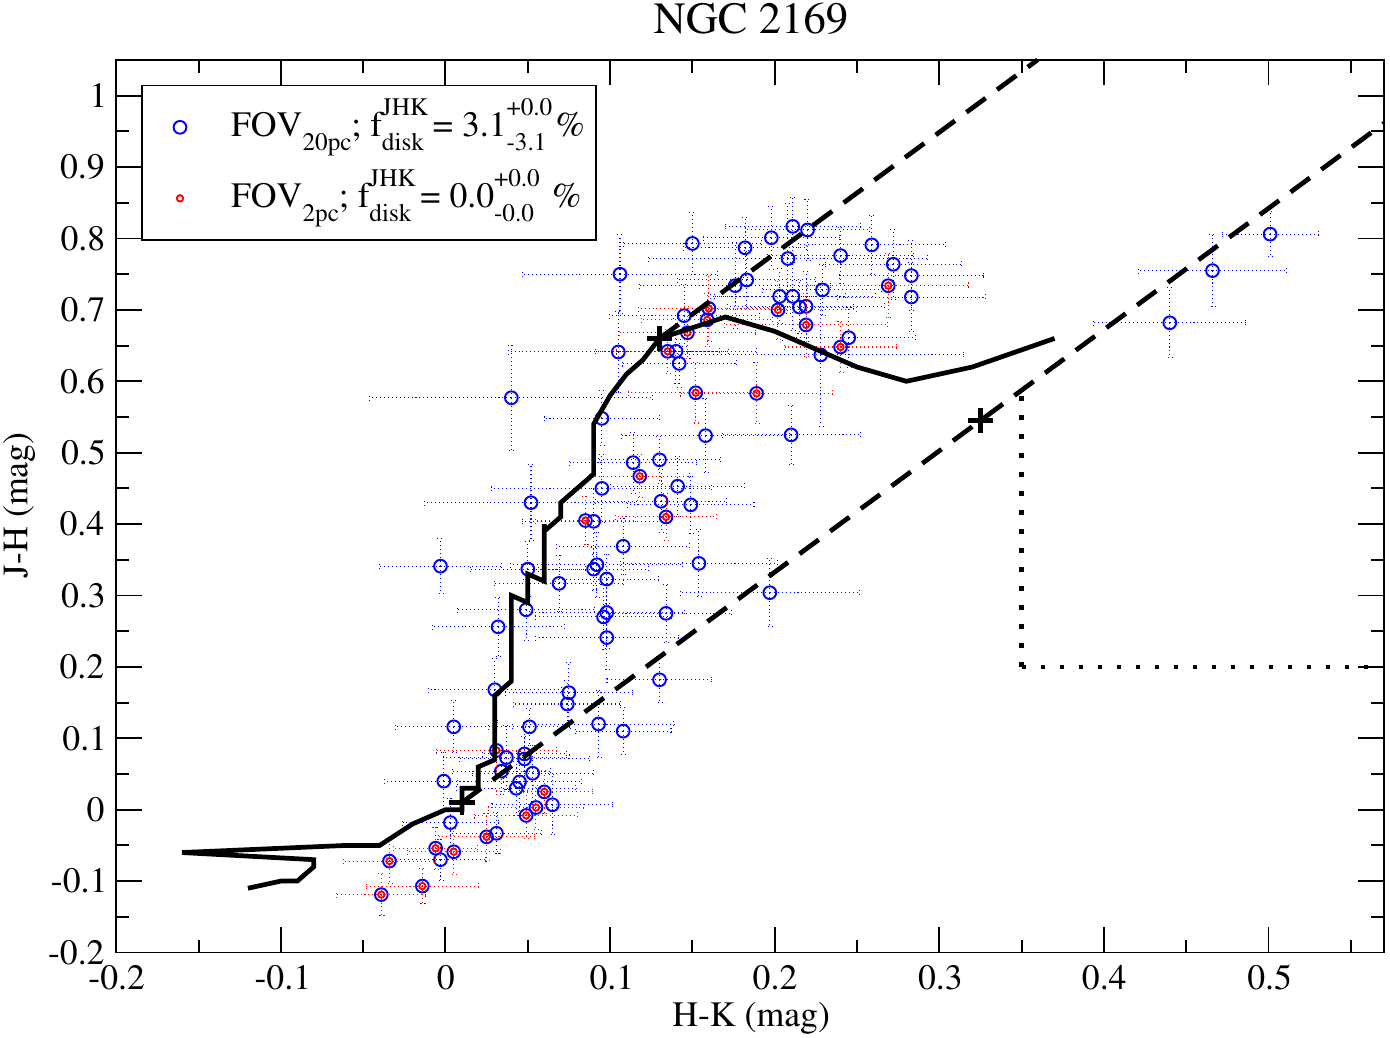
| NGC 2169 |
98/102 |
3.1-3.1+0.0 |
59/62 (0.9) |
3.4
-3.4+0.0 (0.9) |
23/26 |
0.0
-0.0+0.0 |
21/23 (0.9) |
0.0
-0.0+0.0 (0.9) |
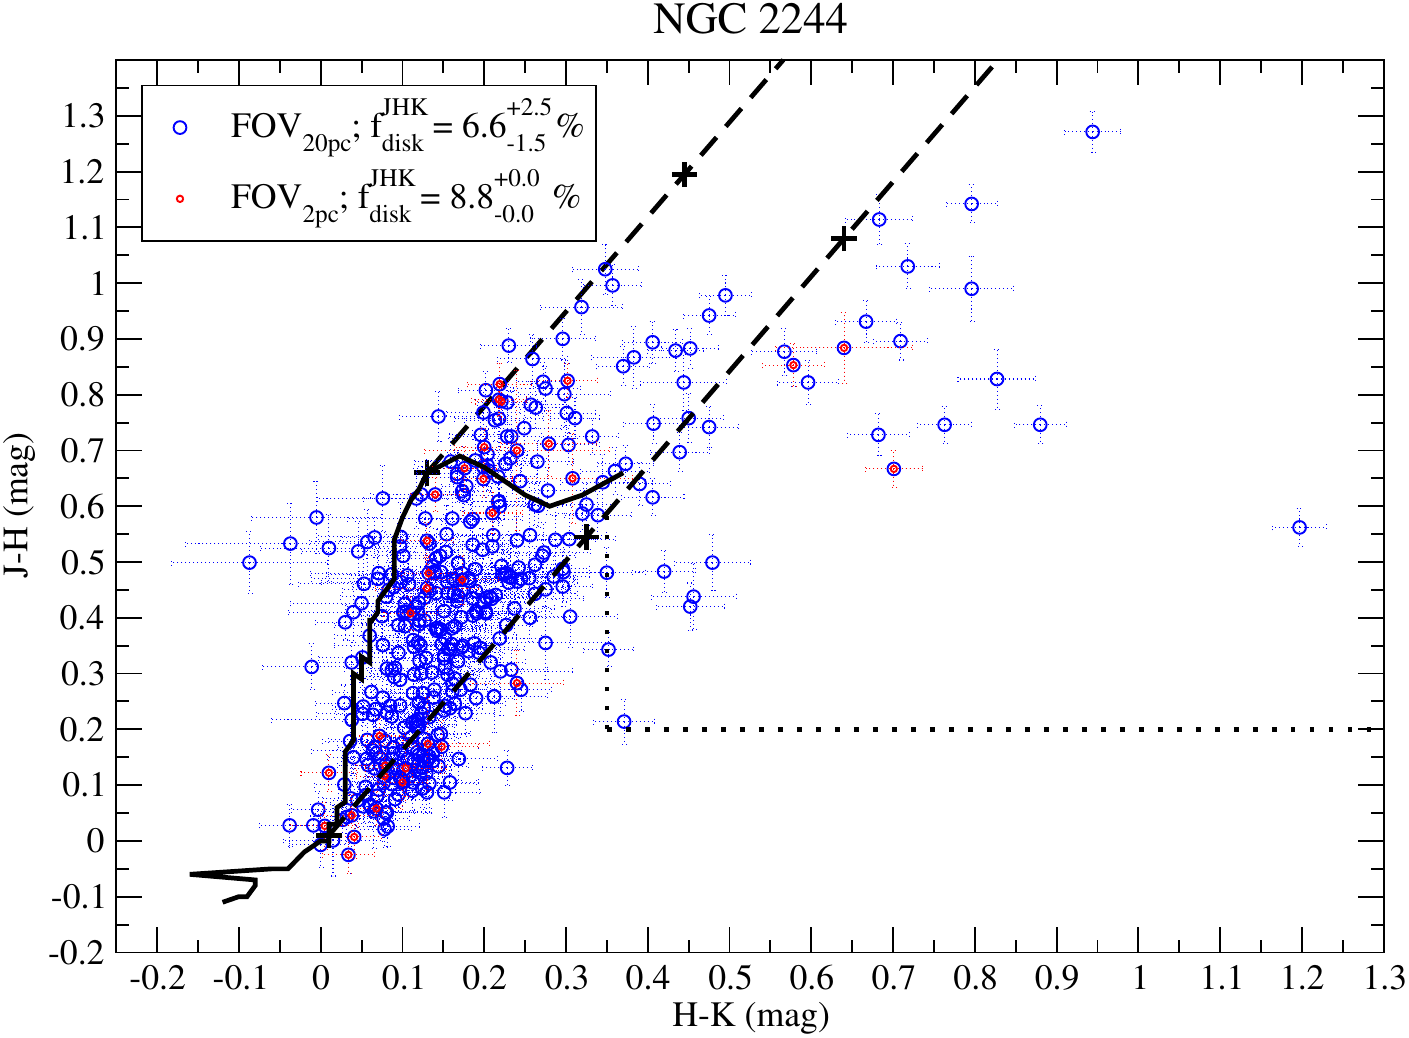
| NGC 2244 |
407/418 |
6.6-1.5+2.5 |
140/147 (0.9) |
7.9
-1.4+3.6 (0.9) |
34/35 |
8.8
-0.0+0.0 |
28/28 (0.9) |
7.1
-0.0+0.0 (0.9) |
| NGC 2264 |
441/452 |
8.4-1.8+2.0 |
165/166 (0.8) |
13.9
-2.4+1.2 (0.8) |
140/142 |
11.4
-2.9+2.1 |
91/91 (0.8) |
14.3
-4.4+2.2 (0.8) |
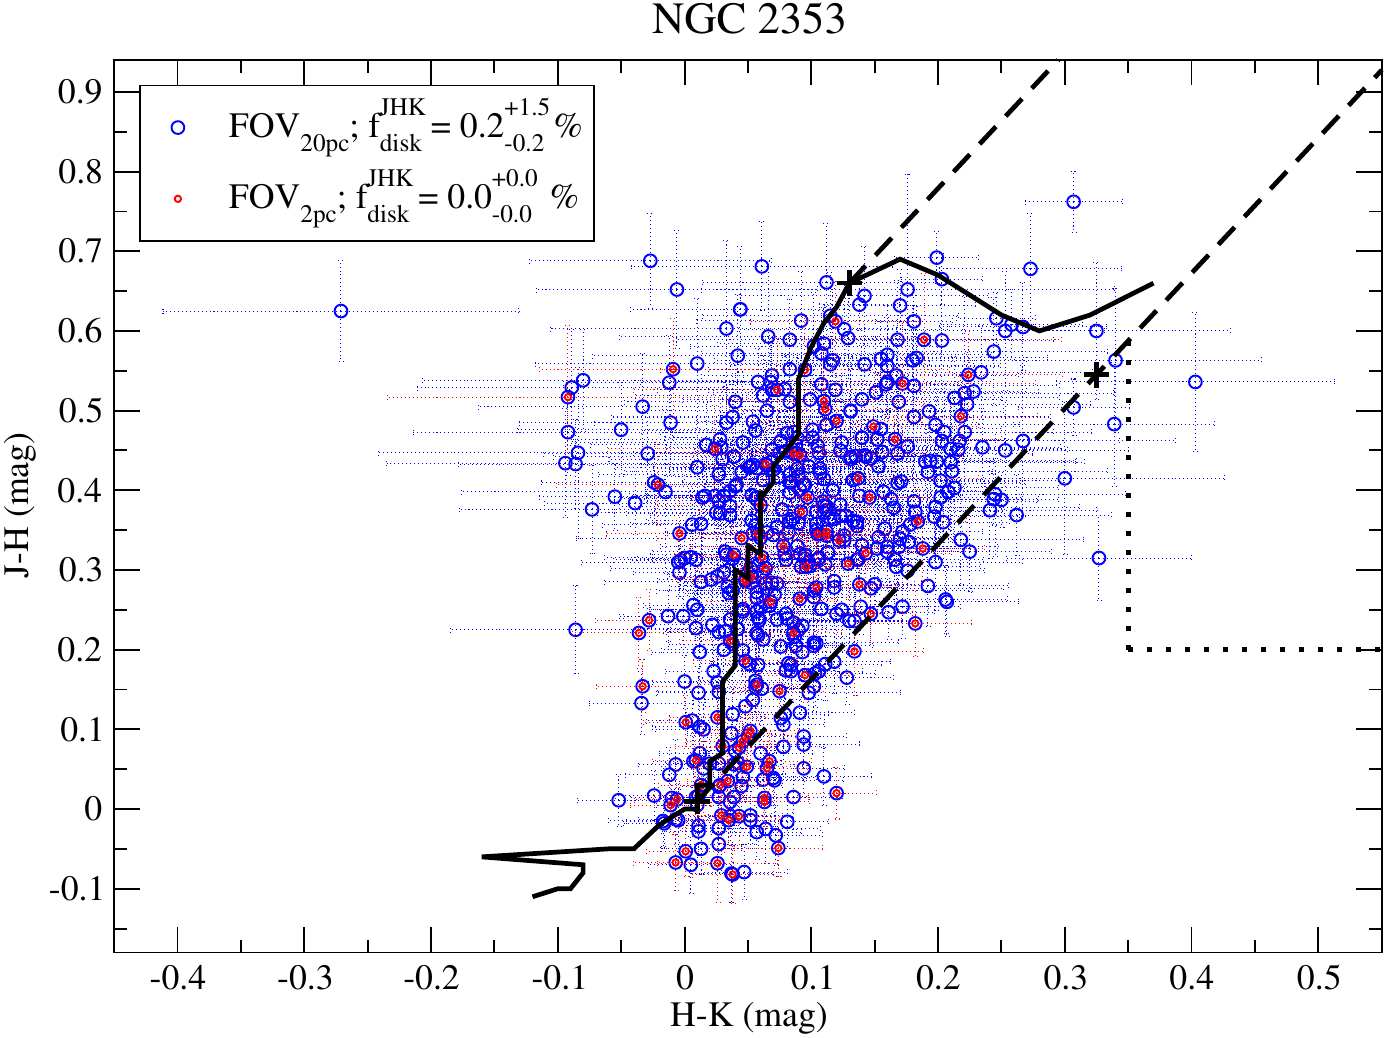
| NGC 2353 |
530/545 |
0.2-0.2+1.5 |
236/243 (0.8) |
0.4
-0.4+0.8 (0.8) |
87/92 |
0.0
-0.0+0.0 |
75/80 (0.8) |
0.0
-0.0+0.0 (0.8) |
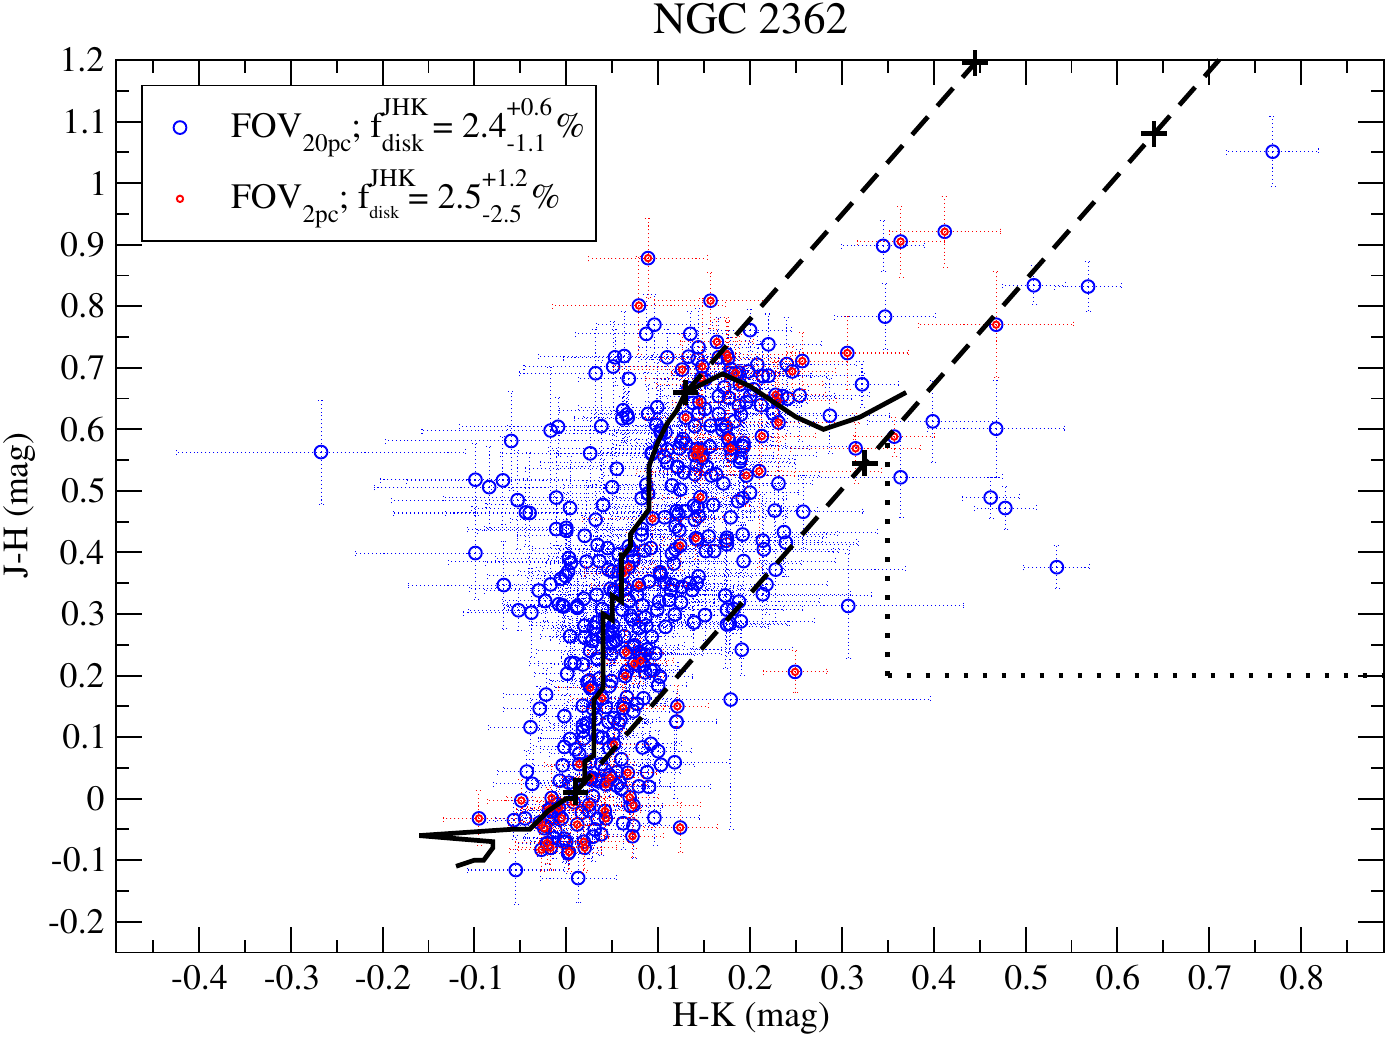
| NGC 2362 |
461/485 |
2.4-1.1+0.6 |
162/170 (0.9) |
2.5
-1.2+0.6 (0.9) |
80/90 |
2.5
-2.5+1.2 |
56/63 (0.9) |
1.8
-1.8+1.8 (0.9) |
| γ Vel |
780/810 |
0.6-0.4+2.3 |
399/415 (0.5) |
0.8
-0.5+2.5 (0.5) |
94/99 |
1.1
-0.0+2.1 |
74/78 (0.5) |
0.0
-0.0+2.7 (0.5) |
| ASCC 58 |
150/160 |
0.0-0.0+1.3 |
112/118 (0.5)† |
0.0
-0.0+1.8 (0.5)† |
14/16 |
0.0
-0.0+0.0 |
13/15 (0.5)† |
0.0
-0.0+0.0 (0.5)† |
| Trumpler 15 |
738/870 |
4.9-0.8+3.9 |
167/207 (0.8) |
3.6
-1.2+4.2 (0.8) |
70/94 |
2.9
-0.0+1.4 |
34/49 (0.8) |
0.0
-0.0+0.0 (0.8) |
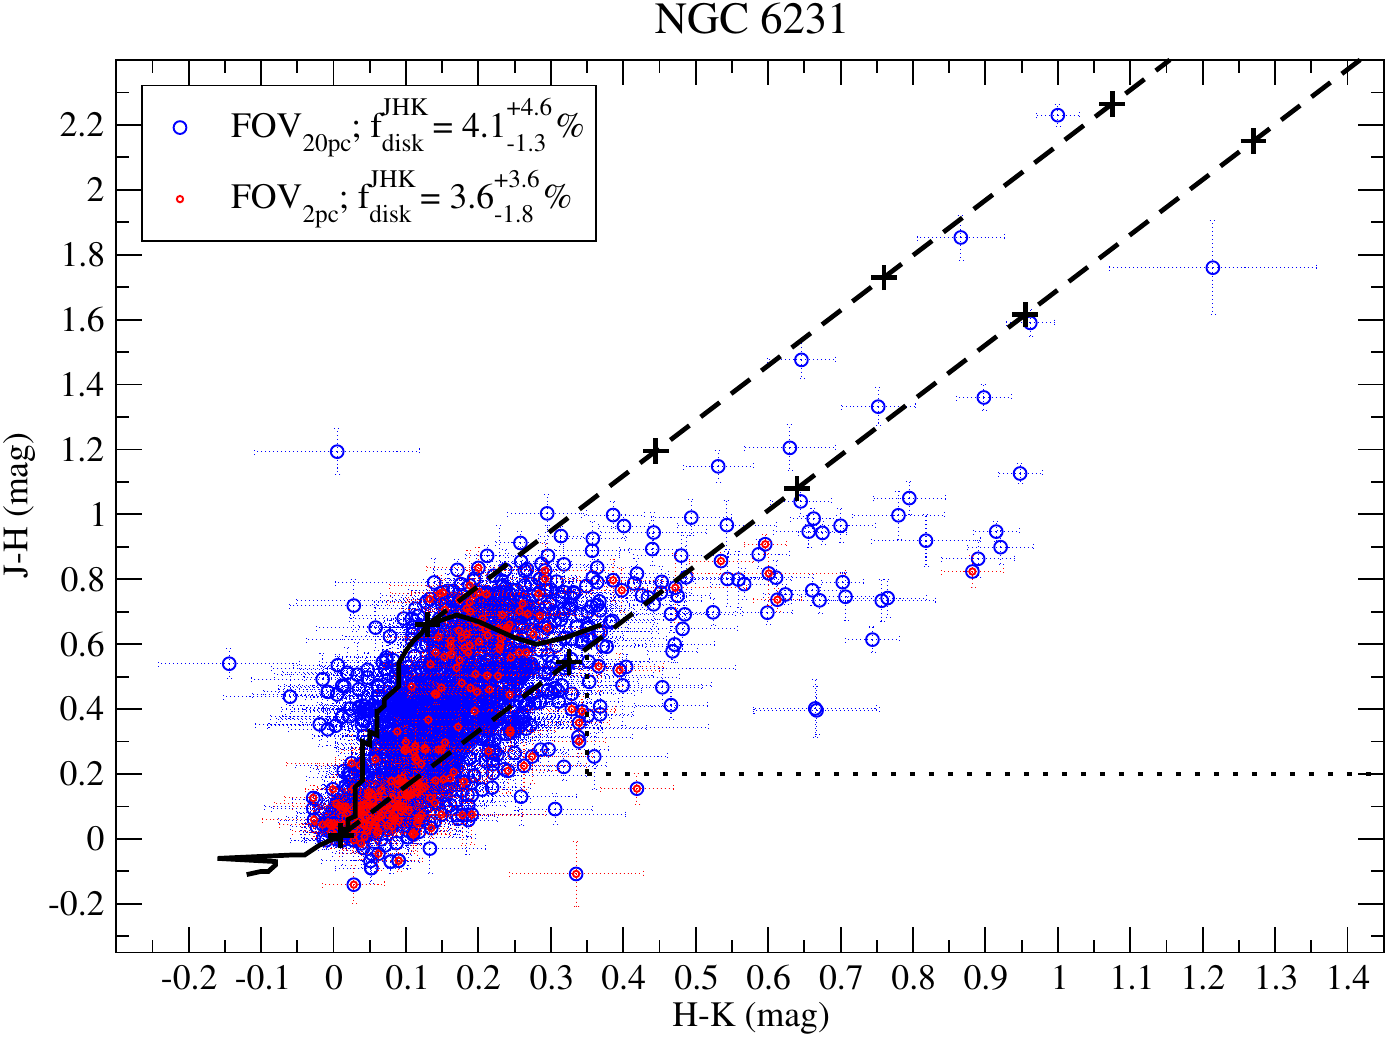
| NGC 6231 |
1477/1726 |
4.1-1.3+4.6 |
616/714 (0.7) |
4.9
-1.3+4.1 (0.7) |
225/265 |
3.6
-1.8+3.6 |
183/214 (0.7) |
2.7
-1.1+3.8 (0.7) |
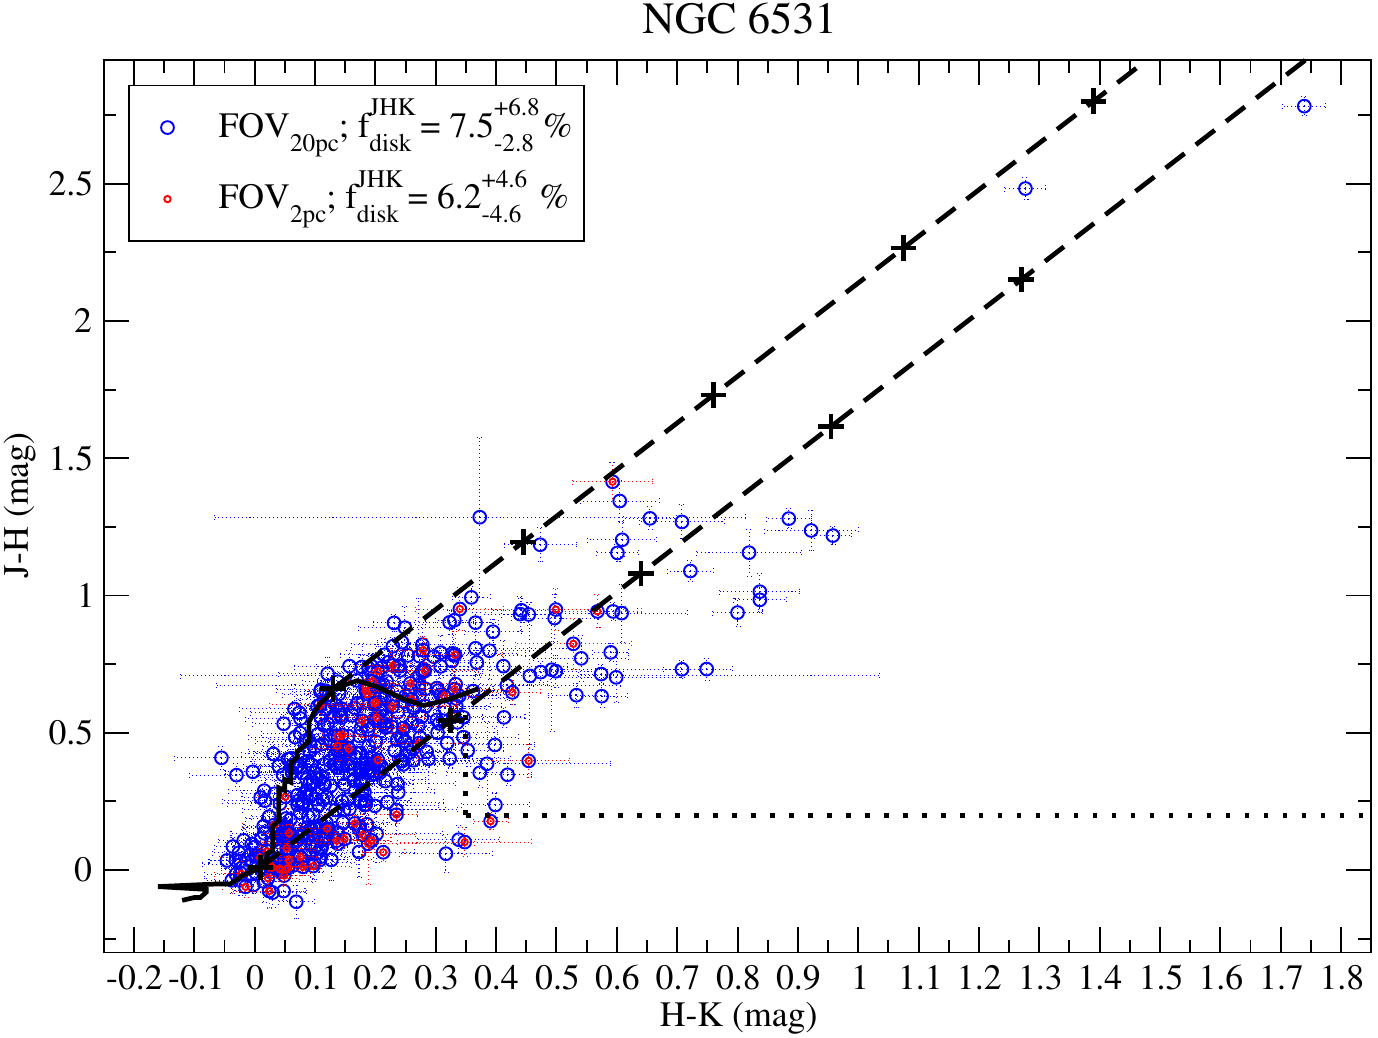
| NGC 6531 |
469/696 |
7.5-2.8+6.8 |
282/404 (0.6) |
8.2
-2.5+6.0 (0.6) |
65/91 |
6.2
-4.6+4.6 |
61/83 (0.6) |
6.6
-4.9+4.9 (0.6) |
| NGC 6611 |
652/809 |
6.1-2.4+6.9 |
35/45 (0.99) |
5.7
-0.0+2.9 (0.99) |
61/72 |
6.6
-4.9+11.5 |
19/23 (0.99) |
0.0
-0.0+5.3 (0.99) |
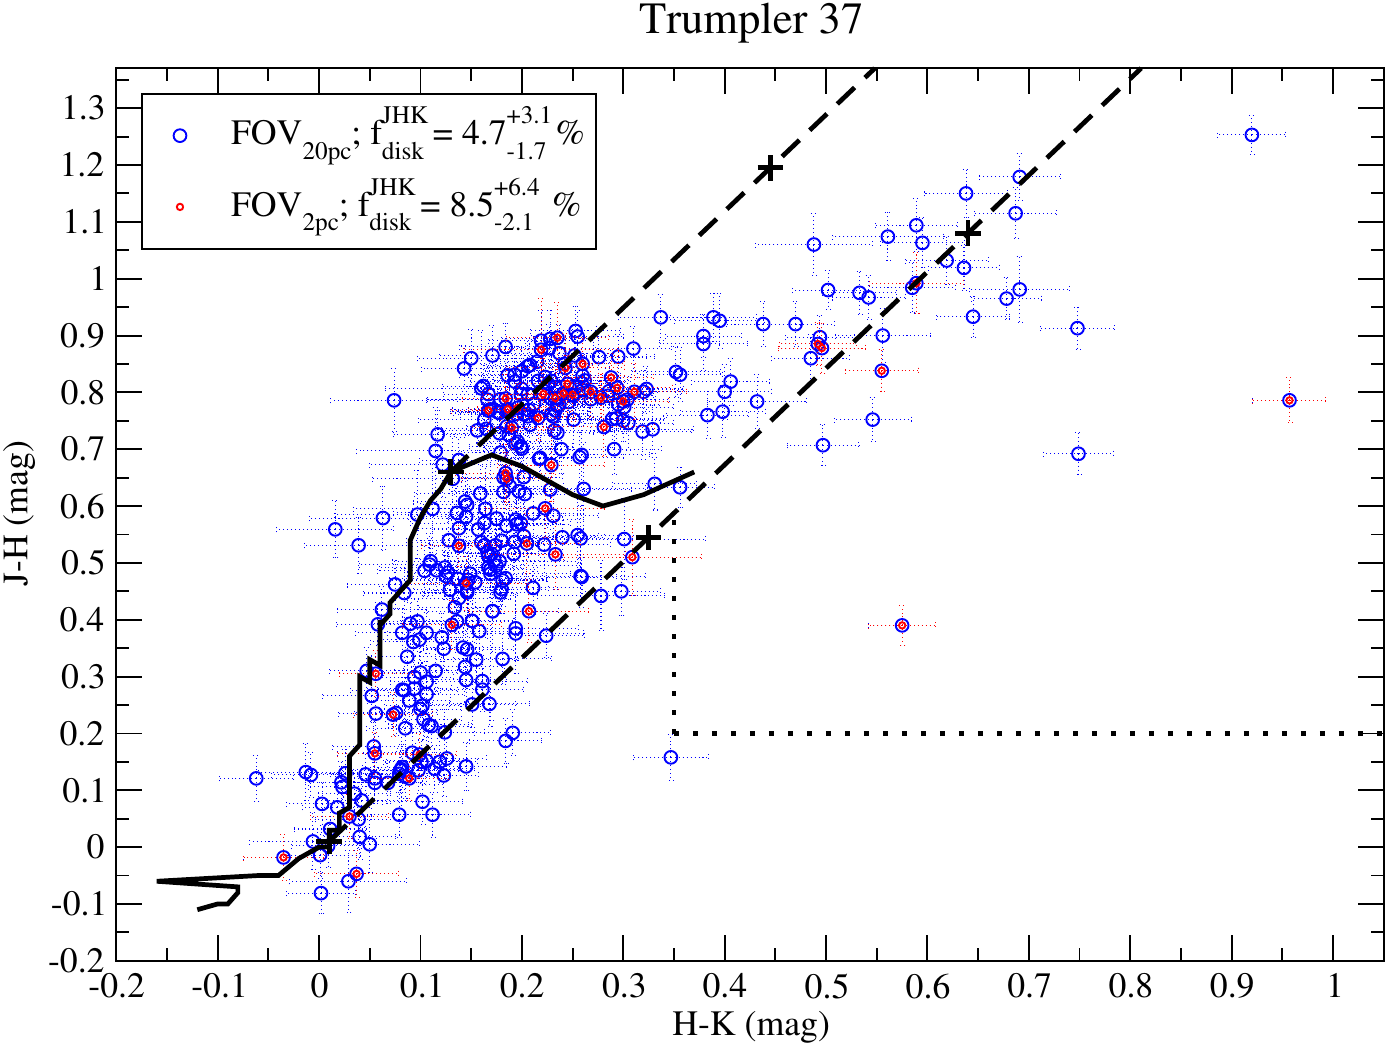
| Trumpler 37 |
360/381 |
4.7-1.7+3.1 |
199/216 (0.4) |
7.0
-1.5+3.5 (0.4) |
47/52 |
8.5
-2.1+6.4 |
38/43 (0.4) |
10.5
-2.6+7.9 (0.4) |
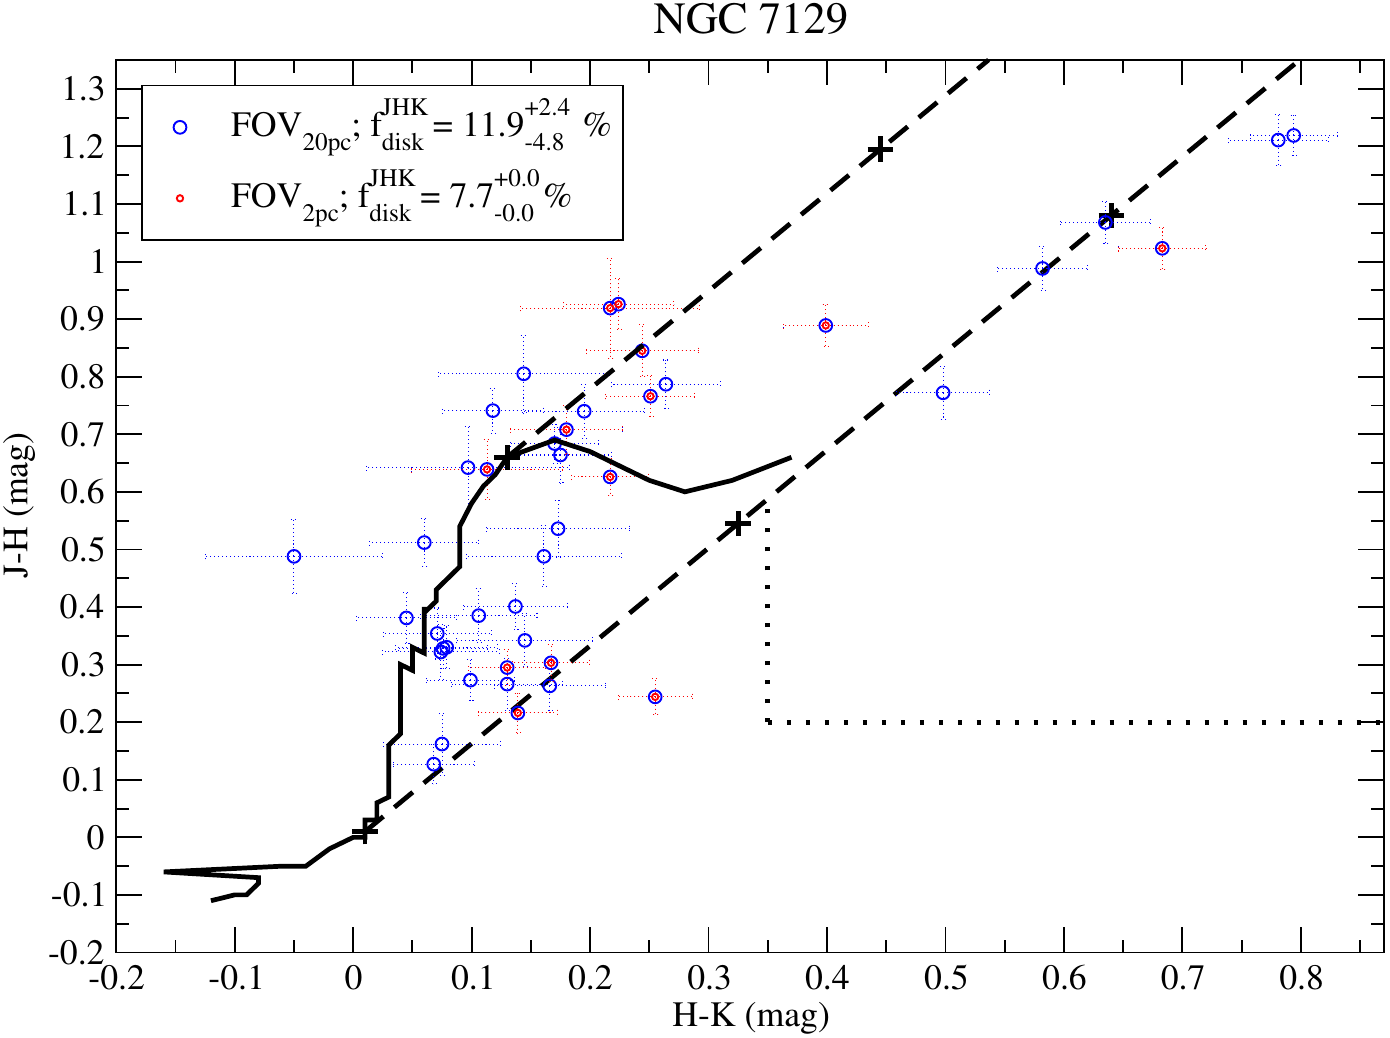
| NGC 7129 |
42/43 |
11.9-4.8+2.4 |
42/43 (0.5)† |
11.9
-4.8+2.4 (0.5)† |
13/14 |
7.7
-0.0+0.0 |
13/14 (0.5)† |
7.7
-0.0+0.0 (0.5)† |
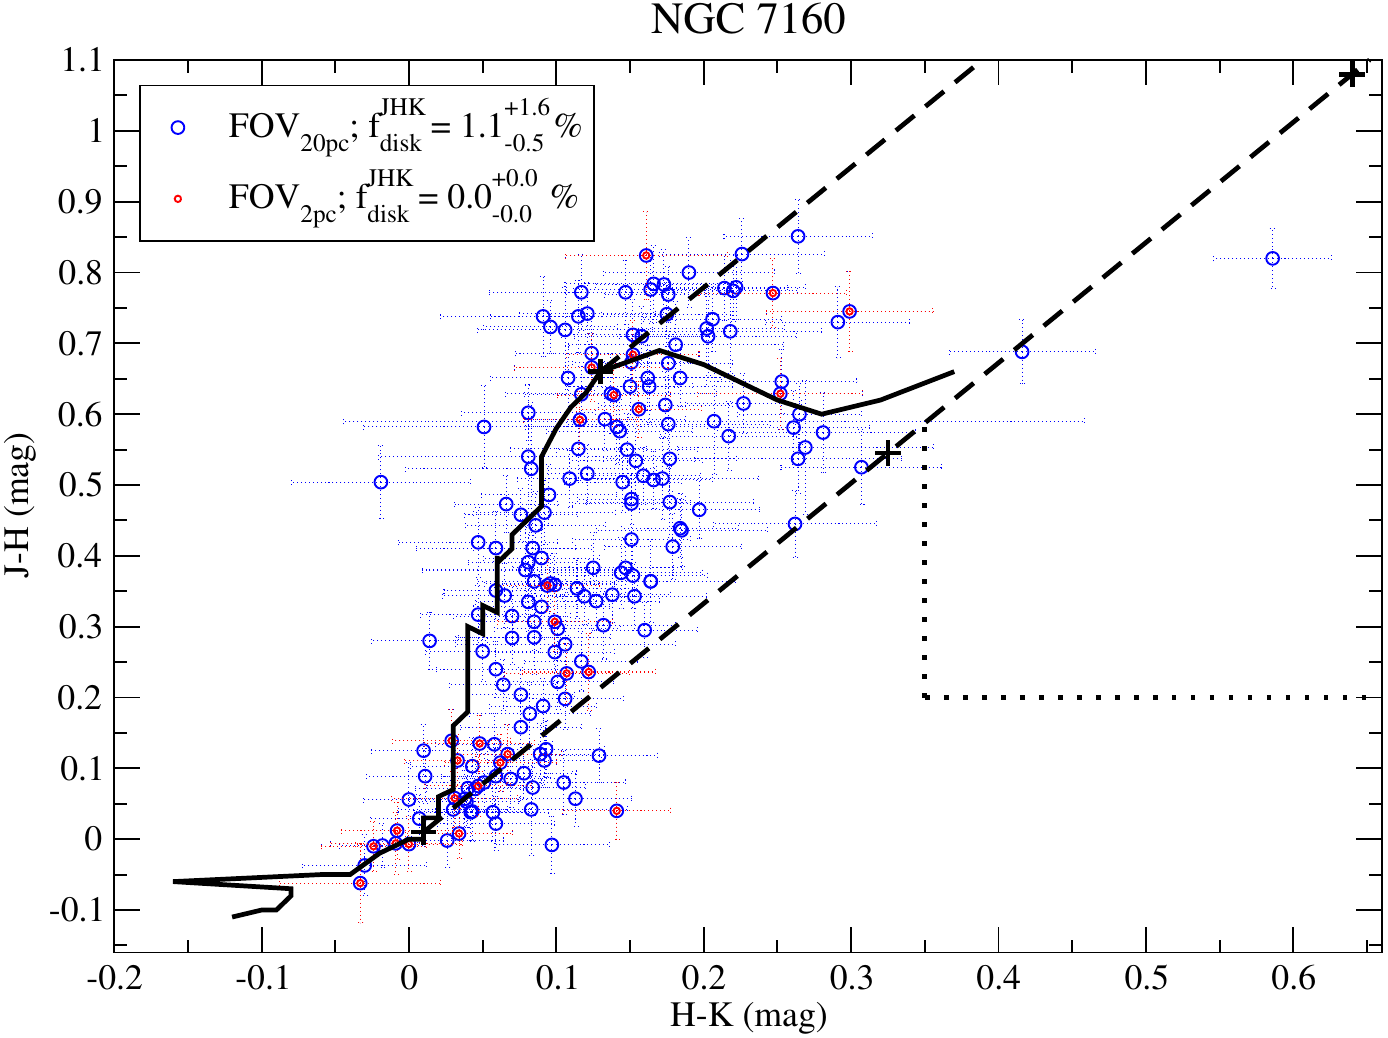
| NGC 7160 |
185/190 |
1.1-0.5+1.6 |
171/176 (0.2) |
1.2
-0.6+1.8 (0.2) |
27/27 |
0.0
-0.0+0.0 |
27/27 (0.2) |
0.0
-0.0+0.0 (0.2) |
|
Notes:
Columns. 2, 3, 6 and 7: ratio between the number of members with JHK counterparts and
the total number of members, and the inner disk fractions (in %) for each cluster and FOV. Rest of
the columns: same values for the stars whose membership probability is above a certain threshold p0
(indicated between parentheses). †p0 values were arbitrarily set to 0.5, given that the KS test already
provided a p-value > 0.05. Listed disk fractions are valid for comparison purposes but should not be taken as absolute values,
given the limitations of our study.
|
|
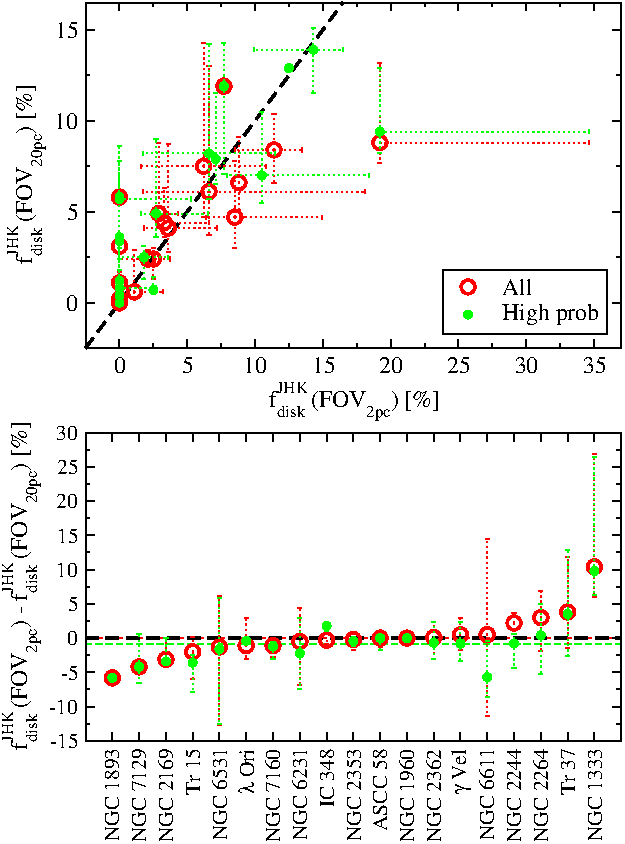
Fig. 1: Disk fractions from the compact and extended regions are plotted against each other in the top panel,
and their differences in the bottom panel. The red and light green circles are results based on all members
identified per cluster or on the high-probability members, respectively. The black dashed lines indicate
equal values in both panels, and the mean differences are shown in the bottom panel with red and green dashed lines.
|
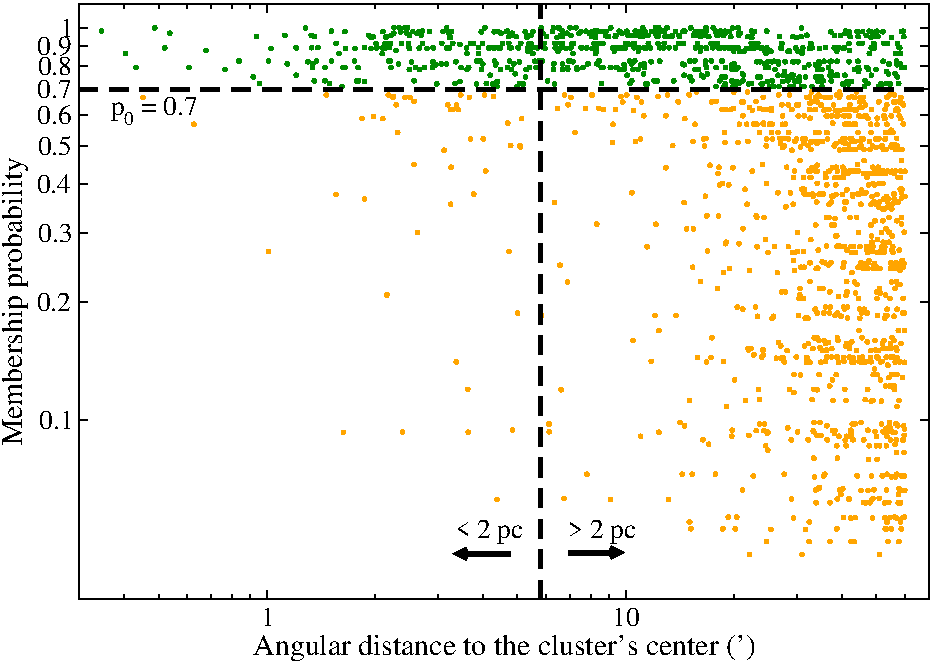
Fig. 2: Membership probability against angular distance to the center of NGC 6231 for all members identified in this
cluster (log-scale). The vertical dashed line defines two sub-samples closer and further than 2 pc from the cluster’s
center. The horizontal dashed line indicates the probability threshold p 0 below which the KS test rules out that the
probability distributions of both previous sub-samples are drawn from the same parent distribution. The resulting high and
low probability members are indicated with dark green and orange, respectively.
|
|
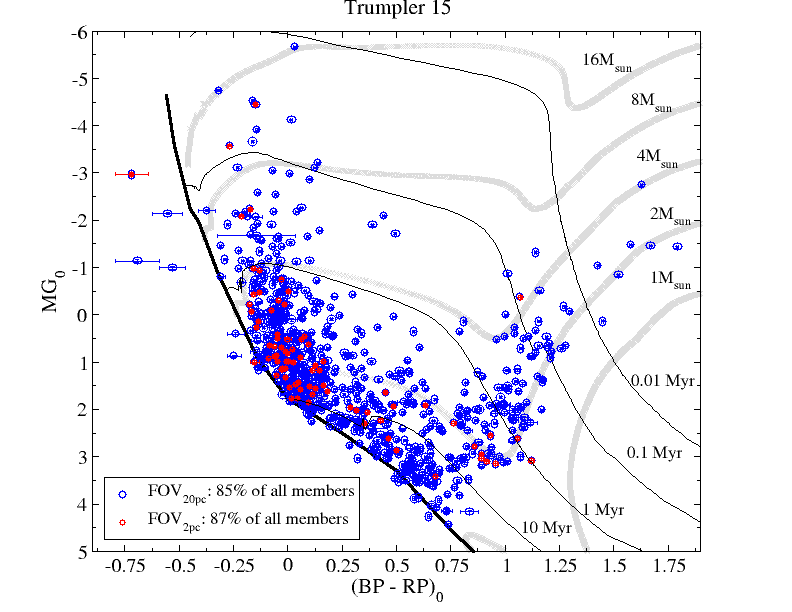
Fig. 3: Extinction corrected Gaia CMD of NGC 6231, where the high and low probability members are indicated with
dark green and orange as identified in Fig. 2. In this case 90% and 91% of the high- and low-probability members are
shown, given that extinction values are not available for the rest. The ZAMS loci is indicated with the black solid curve.
PMS isochrones and evolutionary tracks are overplotted in black and gray for the stellar ages and masses indicated.

|
Fig. 4: Mean optical extinction from the stars located closer and further than 2 pc from the center of each cluster are
plotted against each other in the top panel (log-scale), and their differences in the bottom panel. The dashed lines
indicate equal values in both panels. Standard deviations within each cluster are adopted as errorbars in the top panel.
Uncertainties in the bottom panel are derived from the propagation of the individual 1σ deviations. The fraction of member
stars for which extinction values from Anders et al. (2022) are available for each cluster is indicated above the arrows
in the bottom panel.

|
Table A.1:
Young Stellar Clusters. Regions and membership.
| | FOV20pc | FOV2pc |
| Name | RAcent | DECcent | R | Nmemb/Ntot | π | pmRA | pmDEC | R | Nmemb/Ntot | π | pmRA | pmDEC |
| ... | (deg) | (deg) | (') | ... | (mas) | (mas yr-1) | (mas yr-1) | (') | ... | (mas) | (mas yr-1) | (mas yr-1) |
| NGC 1333 | 52.2968 | 31.3097 | 240 | 95/43277 | 3.40±0.08 | 6.94±0.73 | -9.37±0.67 | 24 | 28/244 | 3.39±0.08 | 7.00±0.80 | -9.79±0.46 |
| IC 348 | 56.0608 | 32.1560 | 240 | 209/53819 | 3.15±0.08 | 4.36±0.59 | -6.30±0.64 | 24 | 97/312 | 3.14±0.06 | 4.48±0.53 | -6.33±0.52 |
| NGC 1893 | 80.7237 | 33.4438 | 18 | 59/922 | 0.32±0.04 | -0.30±0.14 | -1.41±0.17 | 1.8 | 8/22 | 0.31±0.03 | -0.32±0.04 | -1.38±0.12 |
| ONC | 83.7476 | -5.5132 | 180 | 1218/30216 | 2.52±0.05 | 1.19±0.59 | 0.06±0.84 | 18 | 406/723 | 2.51±0.05 | 1.37±0.62 | 0.18±0.92 |
| λ Ori | 83.7802 | 9.9091 | 180 | 377/55430 | 2.50±0.05 | 1.14±0.47 | -2.06±0.30 | 18 | 63/577 | 2.50±0.05 | 1.00±0.41 | -2.02±0.19 |
| NGC 1960 | 84.0840 | 34.1350 | 60 | 273/9263 | 0.85±0.02 | -0.21±0.15 | -3.39±0.17 | 6 | 114/227 | 0.85±0.02 | -0.21±0.14 | -3.43±0.13 |
| σ Ori | 84.6715 | -2.6186 | 177 | 1742/30380 | 2.62±0.18 | 1.20±0.64 | -0.64±0.65 | 17.7 | 103/461 | 2.52±0.11 | 1.45±0.39 | -0.70±0.43 |
| NGC 2169 | 92.1250 | 13.9510 | 70 | 102/10500 | 1.03±0.04 | -1.25±0.25 | -1.58±0.17 | 7 | 26/153 | 1.03±0.04 | -1.10±0.13 | -1.59±0.12 |
| NGC 2244 | 97.9817 | 4.9390 | 44 | 418/4255 | 0.68±0.04 | -1.65±0.38 | 0.39±0.41 | 4.4 | 35/75 | 0.67±0.04 | -1.75±0.21 | 0.35±0.21 |
| NGC 2264 | 100.2471 | 9.8755 | 120 | 452/32665 | 1.37±0.06 | -1.78±0.38 | -3.68±0.29 | 12 | 142/242 | 1.38±0.05 | -1.68±0.30 | -3.68±0.22 |
| NGC 2353 | 108.6242 | -10.2711 | 60 | 545/11452 | 0.82±0.08 | -1.05±0.43 | 0.77±0.38 | 6 | 92/206 | 0.84±0.05 | -1.09±0.16 | 0.76±0.20 |
| NGC 2362 | 109.6658 | -24.9557 | 52 | 485/12410 | 0.76±0.05 | -2.61±0.46 | 2.93±0.39 | 5.2 | 90/212 | 0.77±0.03 | -2.75±0.21 | 2.98±0.20 |
| γ Vel | 122.3831 | -47.3366 | 180 | 810/134095 | 2.76±0.14 | -6.20±0.44 | 9.08±0.64 | 18 | 99/1364 | 2.87±0.12 | -6.48±0.40 | 9.53±0.56 |
| ASCC 58 | 153.8180 | -55.0003 | 120 | 160/99215 | 2.11±0.07 | -13.42±0.48 | 2.70±0.38 | 12 | 16/1068 | 2.08±0.03 | -13.32±0.31 | 2.71±0.28 |
| Trumpler 15 | 161.1743 | -59.3664 | 26 | 870/6216 | 0.40±0.04 | -6.31±0.35 | 2.14±0.31 | 2.6 | 94/139 | 0.39±0.03 | -6.13±0.21 | 2.08±0.18 |
| NGC 6231 | 253.5356 | -41.8284 | 60 | 1726/26977 | 0.60±0.04 | -0.64±0.32 | -2.12±0.38 | 6 | 265/546 | 0.60±0.04 | -0.58±0.21 | -2.19±0.22 |
| NGC 6531 | 271.0576 | -22.4935 | 55 | 696/15689 | 0.79±0.04 | 0.50±0.34 | -1.46±0.34 | 5.5 | 91/257 | 0.80±0.04 | 0.54±0.21 | -1.42±0.22 |
| NGC 6611 | 274.6993 | -13.8090 | 40 | 809/7796 | 0.59±0.05 | 0.16±0.53 | -1.63±0.58 | 4 | 72/133 | 0.56±0.04 | 0.20±0.31 | -1.66±0.27 |
| Trumpler 37 | 324.7486 | 57.4782 | 73 | 381/18293 | 1.07±0.04 | -2.43±0.52 | -4.28±0.75 | 7.3 | 52/290 | 1.07±0.04 | -2.43±0.33 | -4.47±0.62 |
| NGC 7129 | 325.7401 | 66.1140 | 60 | 43/8627 | 1.07±0.06 | -1.77±0.33 | -3.41±0.39 | 6 | 14/63 | 1.10±0.04 | -1.77±0.18 | -3.45±0.32 |
| NGC 7160 | 328.4142 | 62.6020 | 72 | 190/20532 | 1.06±0.05 | -3.42±0.23 | -1.44±0.34 | 7.2 | 27/213 | 1.09±0.04 | -3.51±0.19 | -1.38±0.18 |
|
Notes.
Columns 1 to 3 list the name of the cluster and the coordinates of its central position. Columns 4 to 8 refer to FOV20pc, listing the associated angular radius, number of members identified divided by the total number of sources within the FOV having Gaia EDR3 proper motions and reliable parallaxes (as defined in Sect.2.1), and inferred mean parallax and proper motions. The rest of the columns are equivalent to the previous, but related to FOV2pc.
|
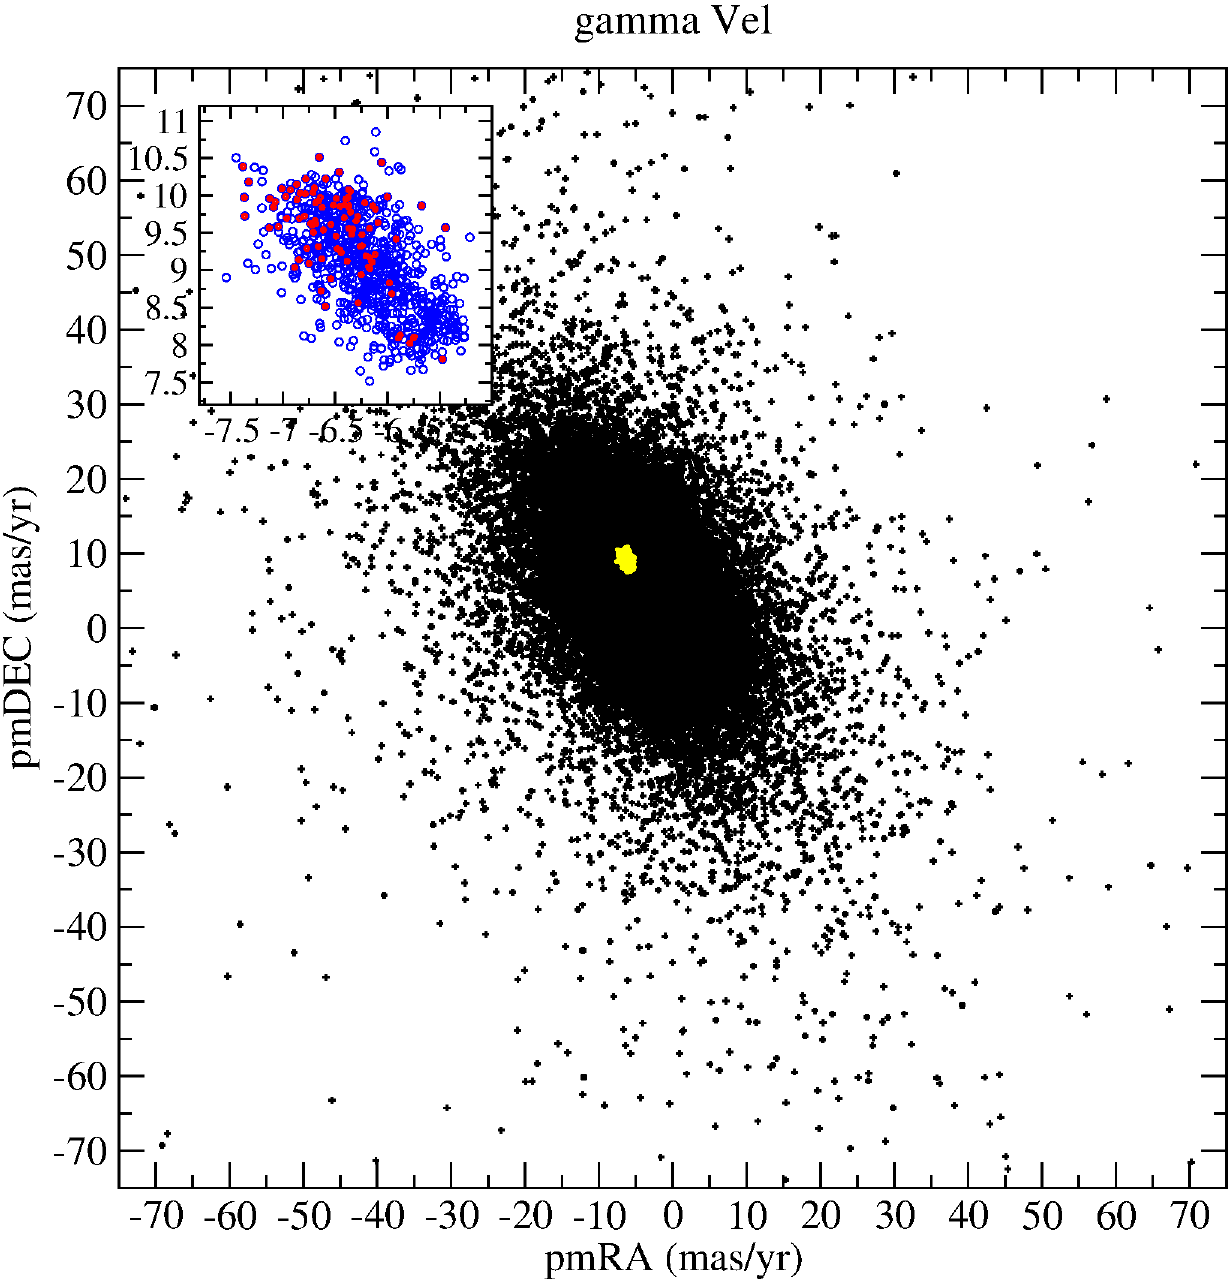
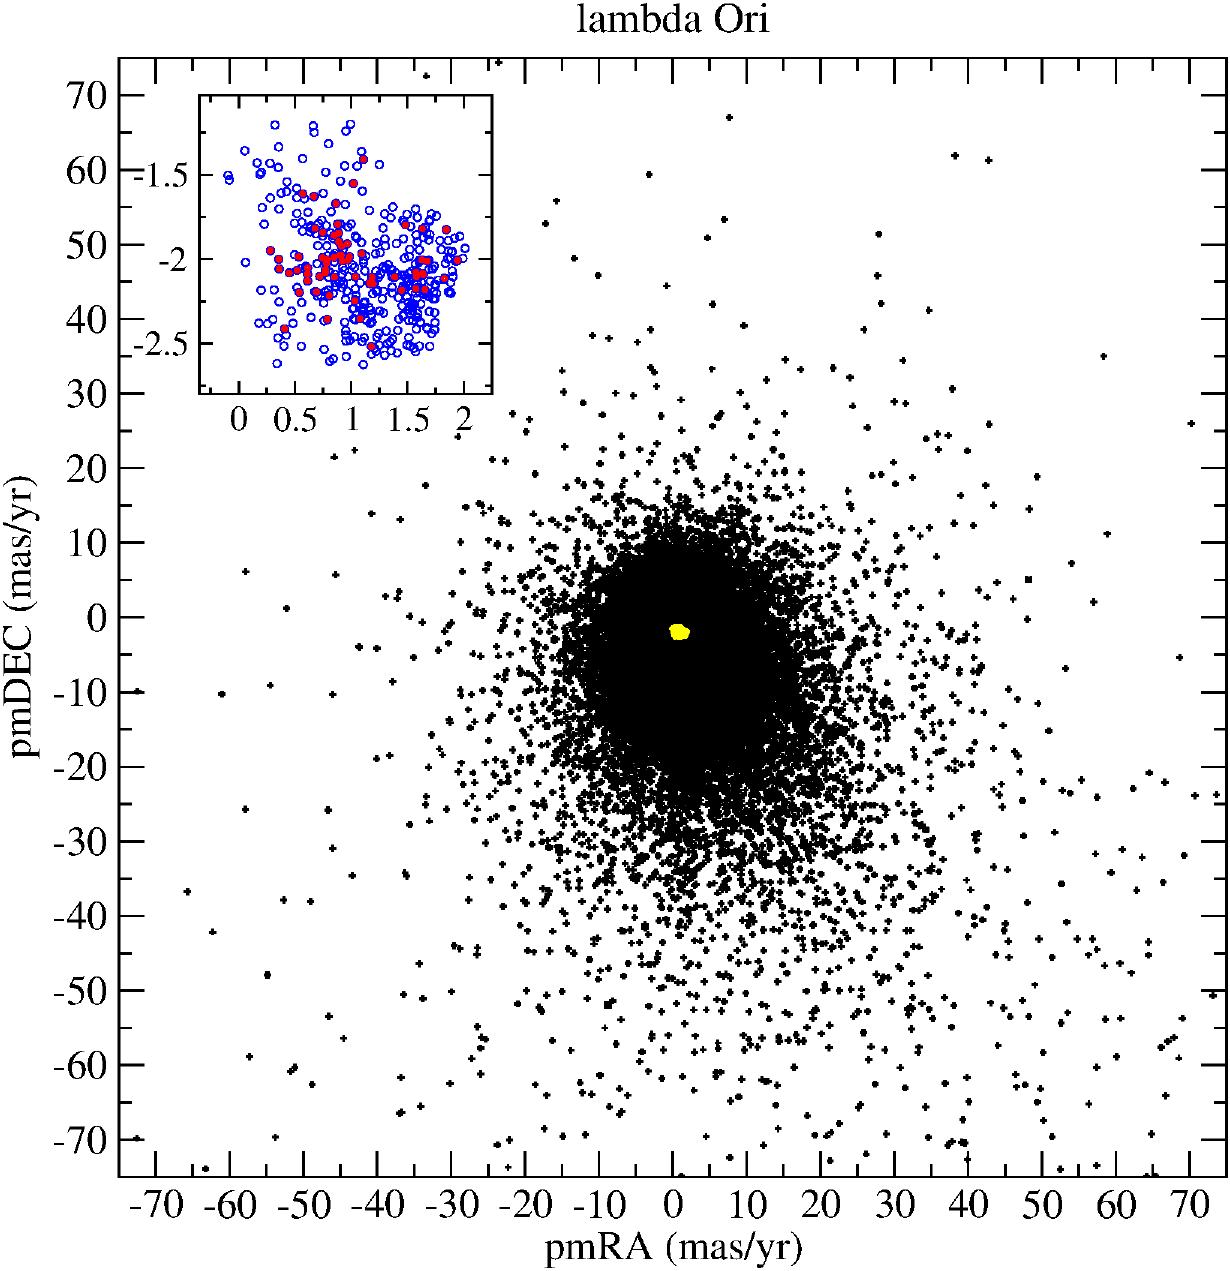
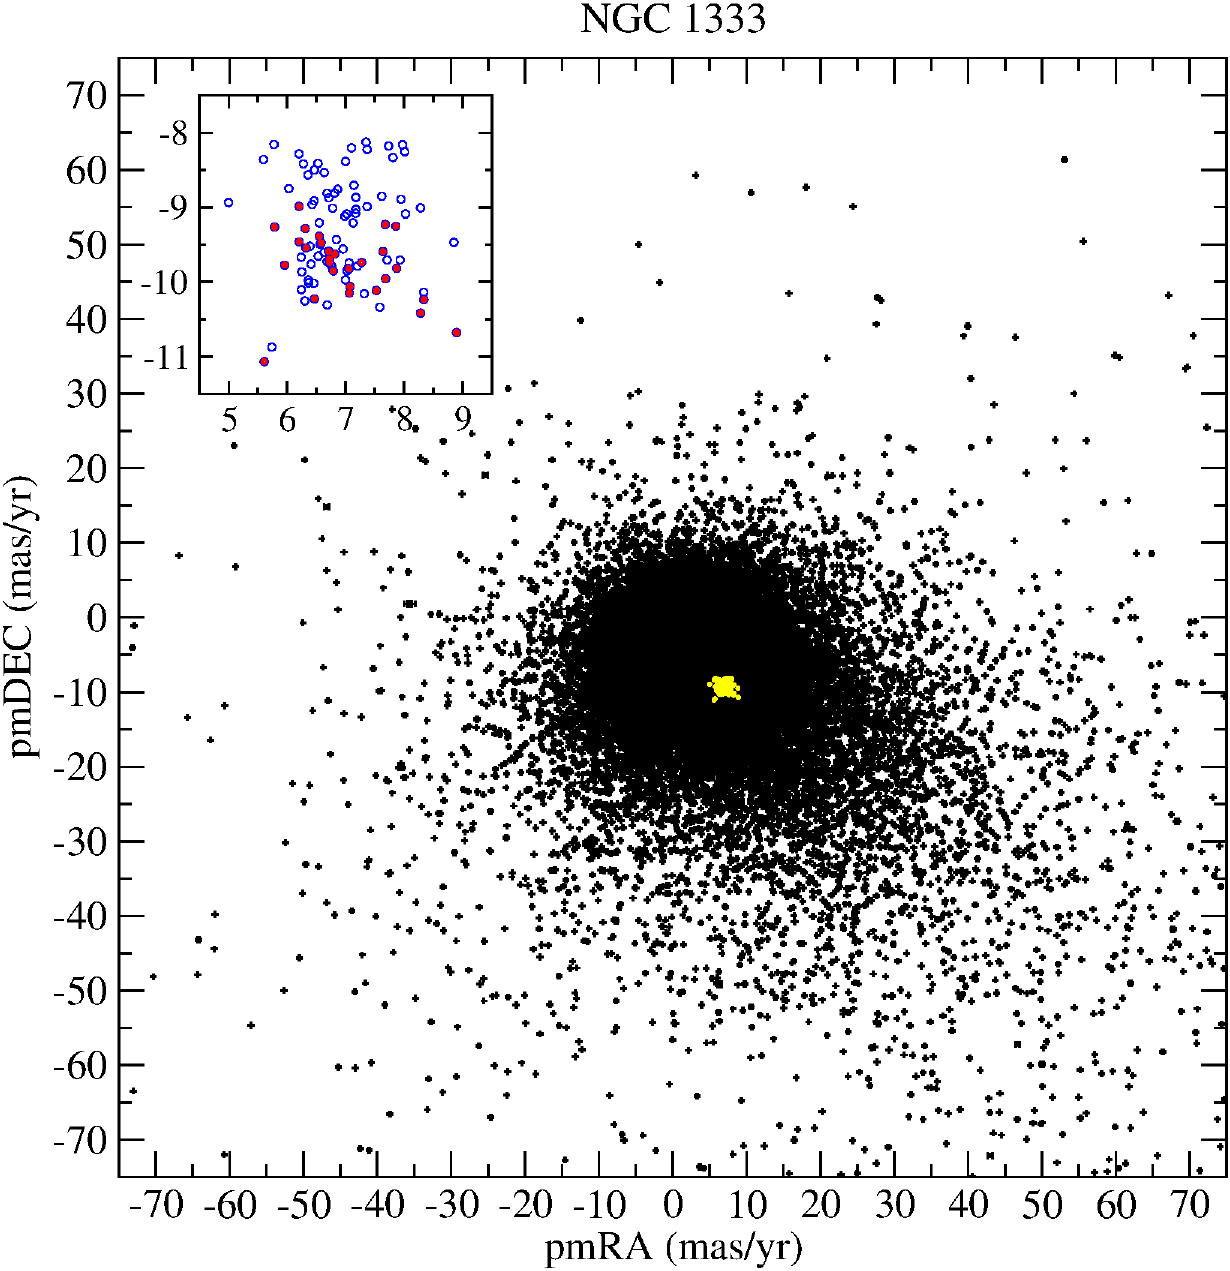
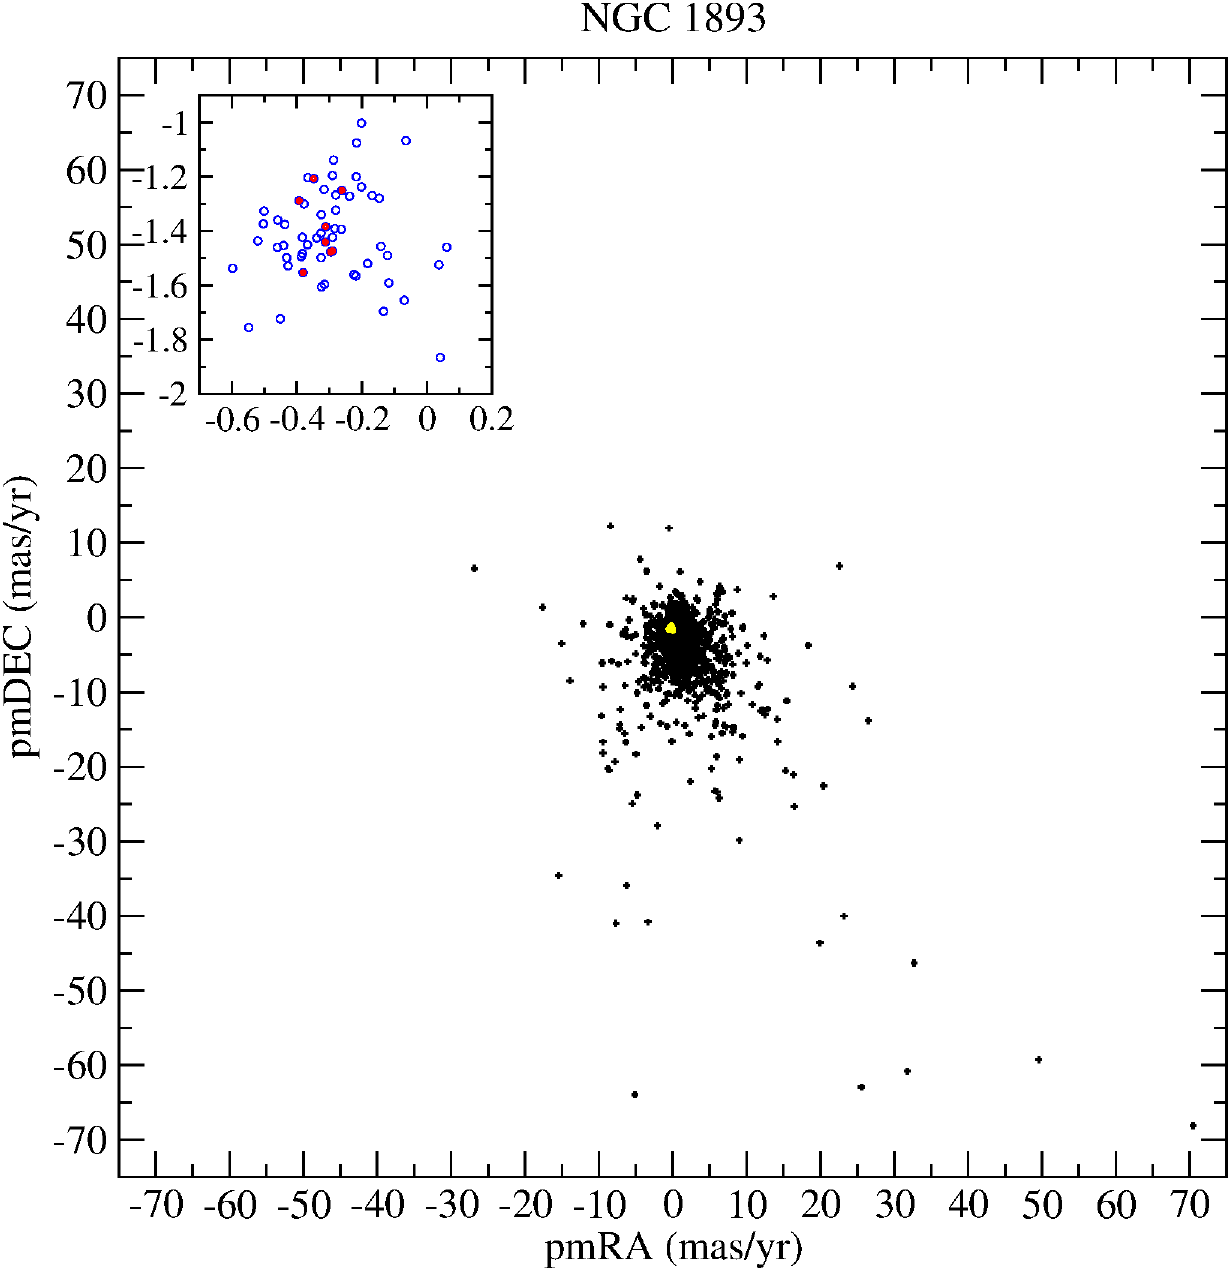
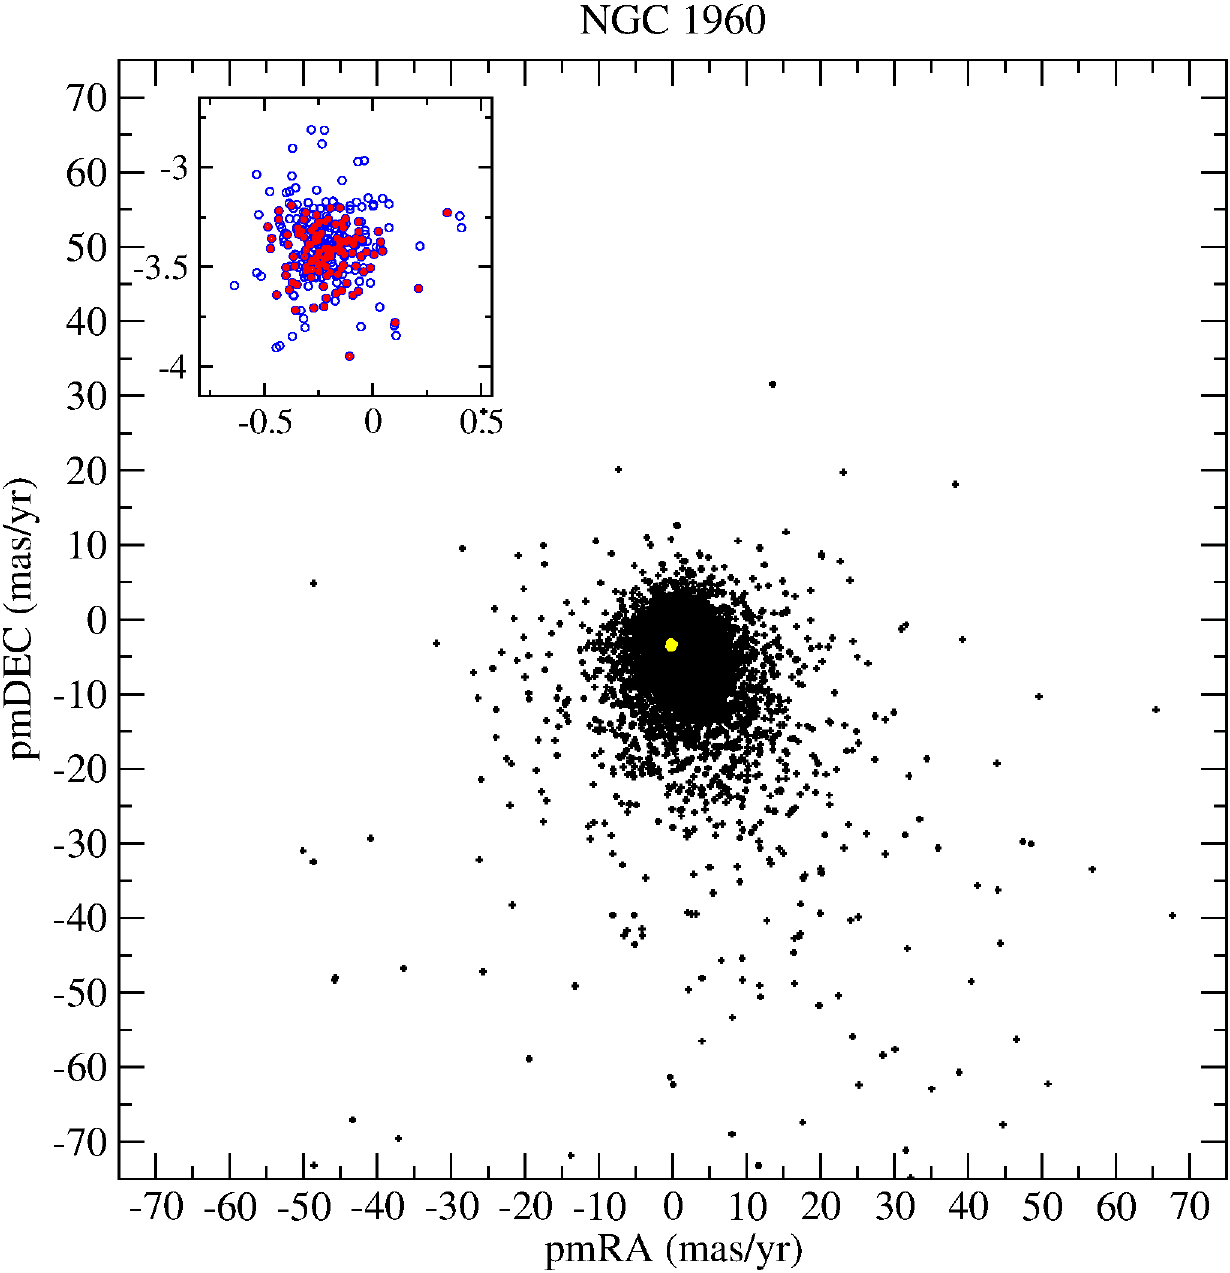
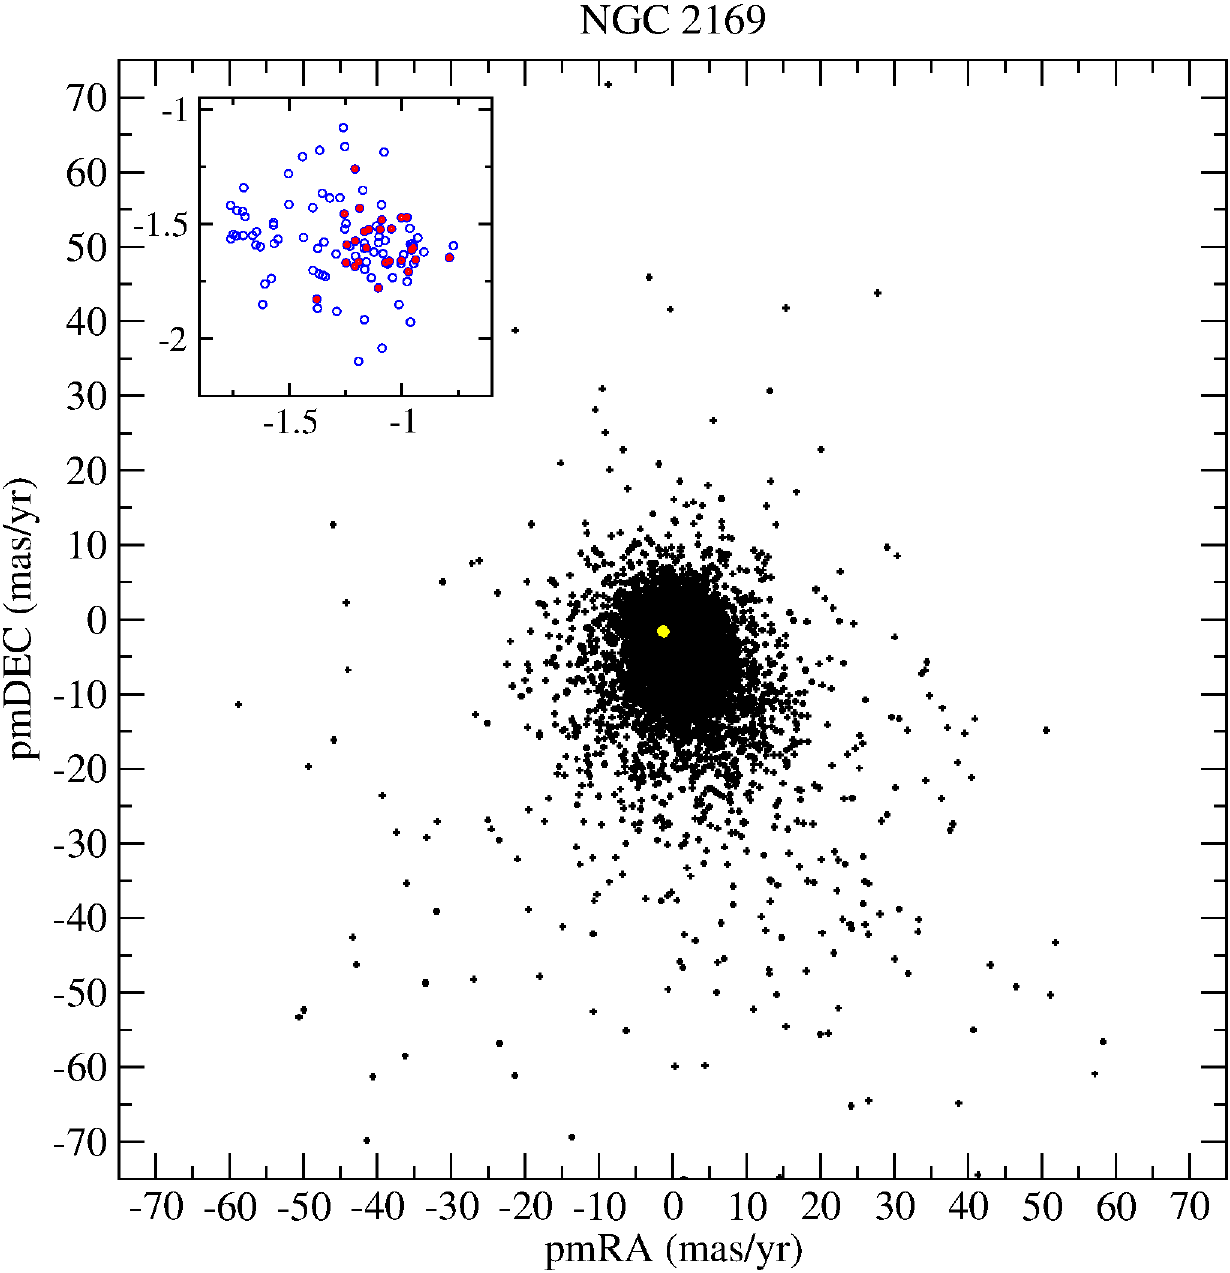
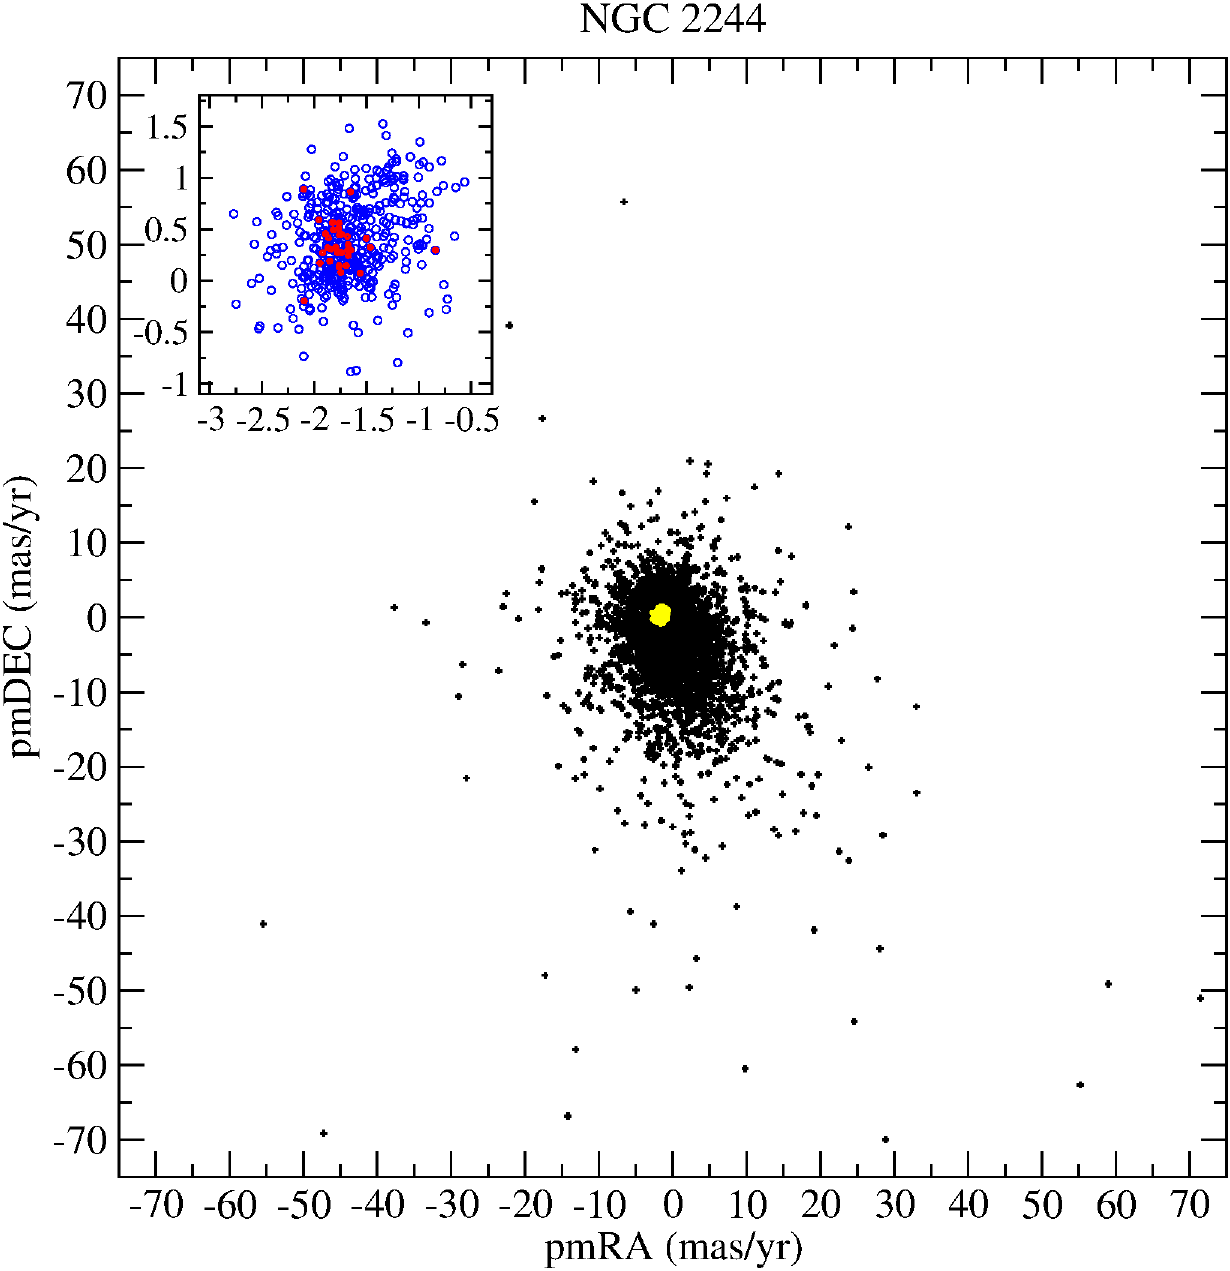
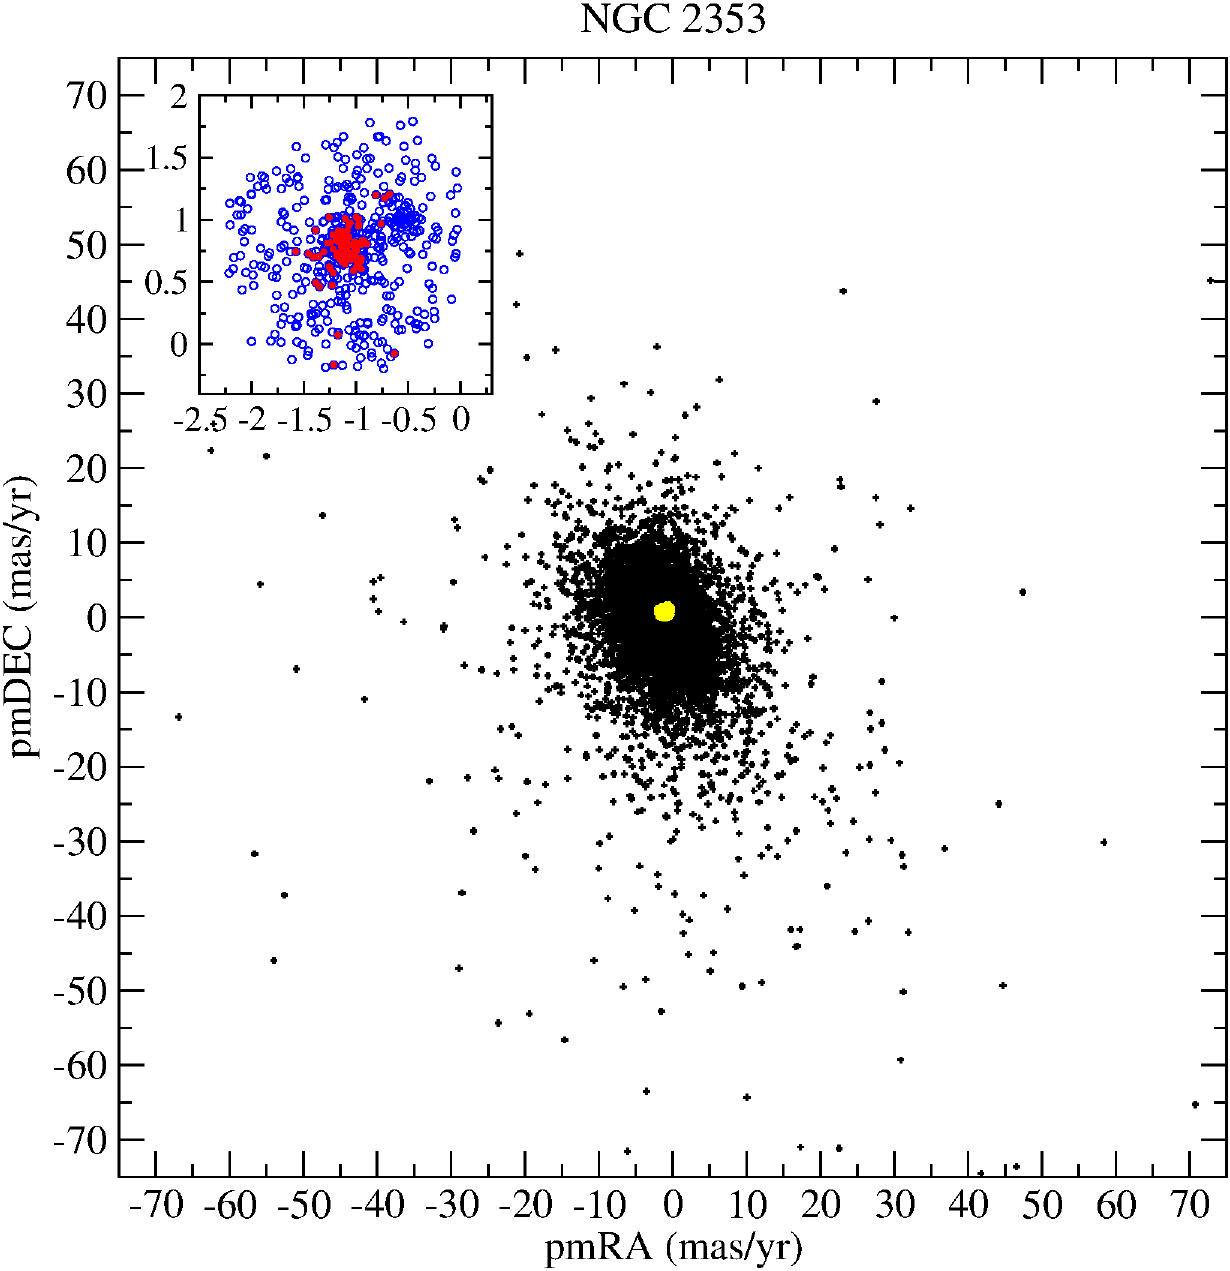
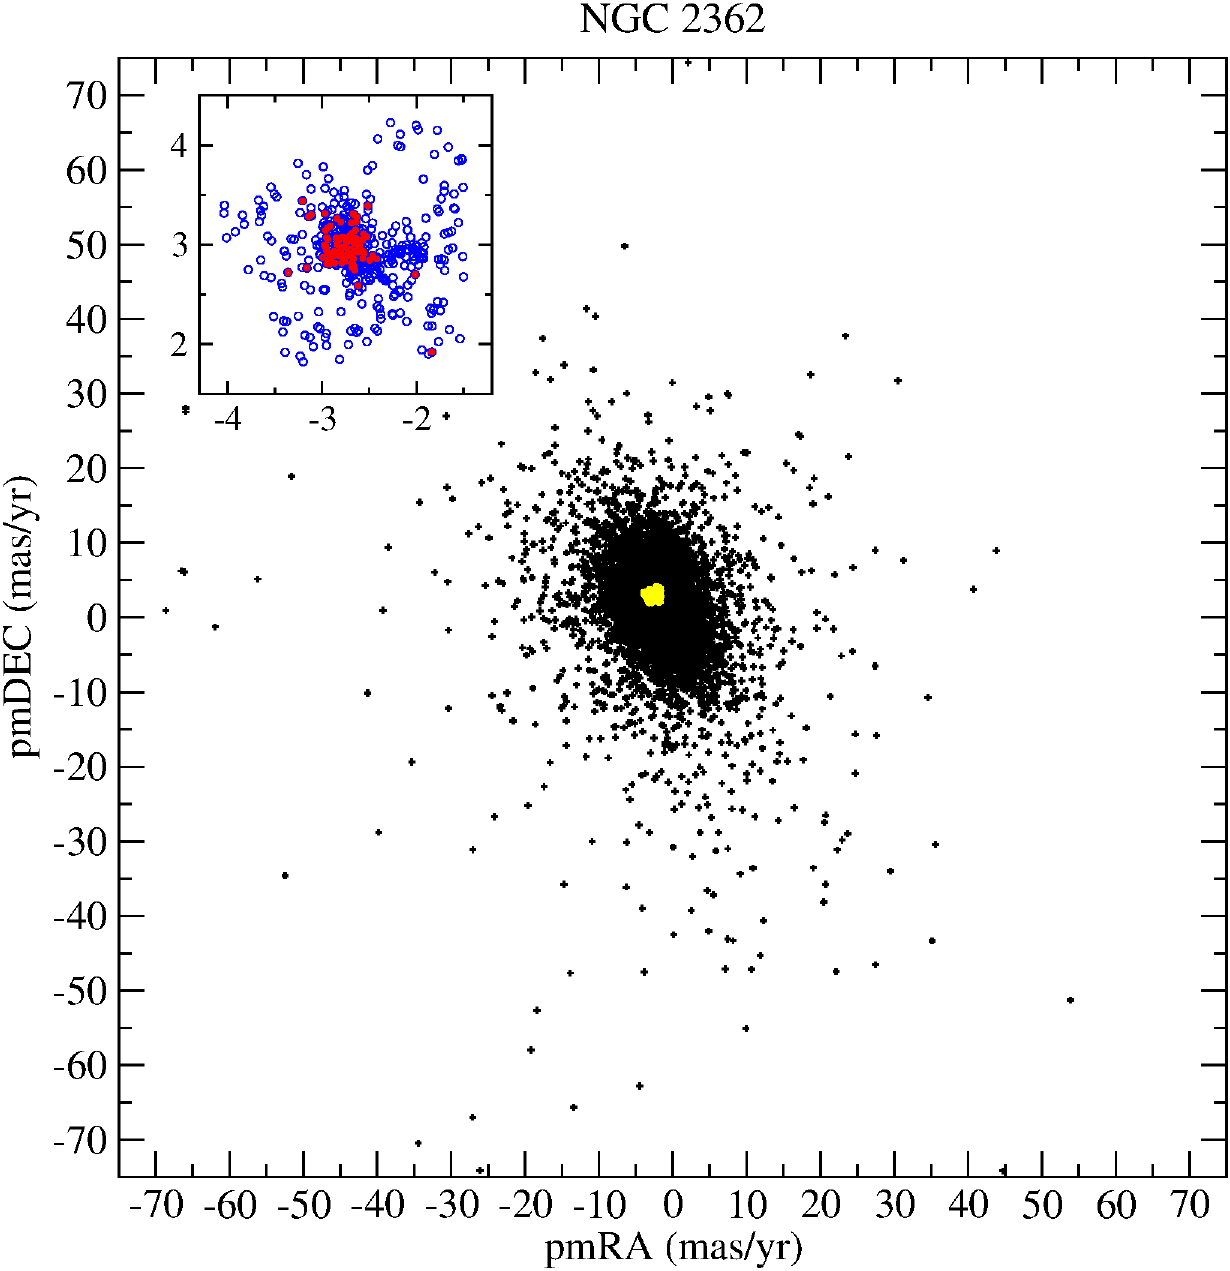
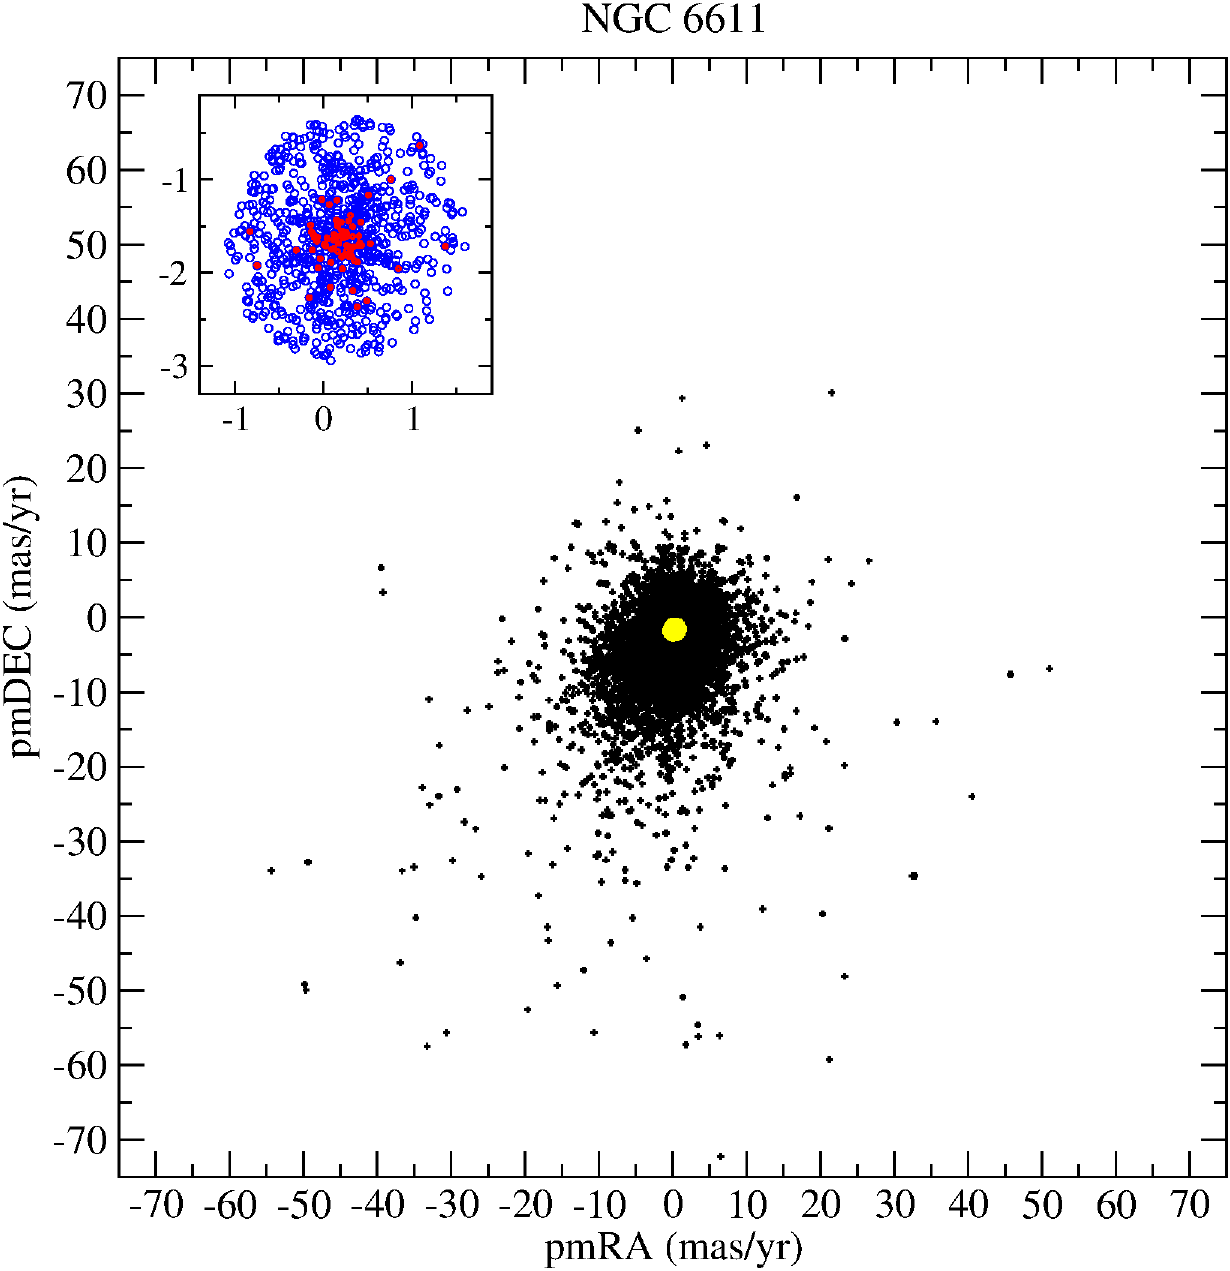
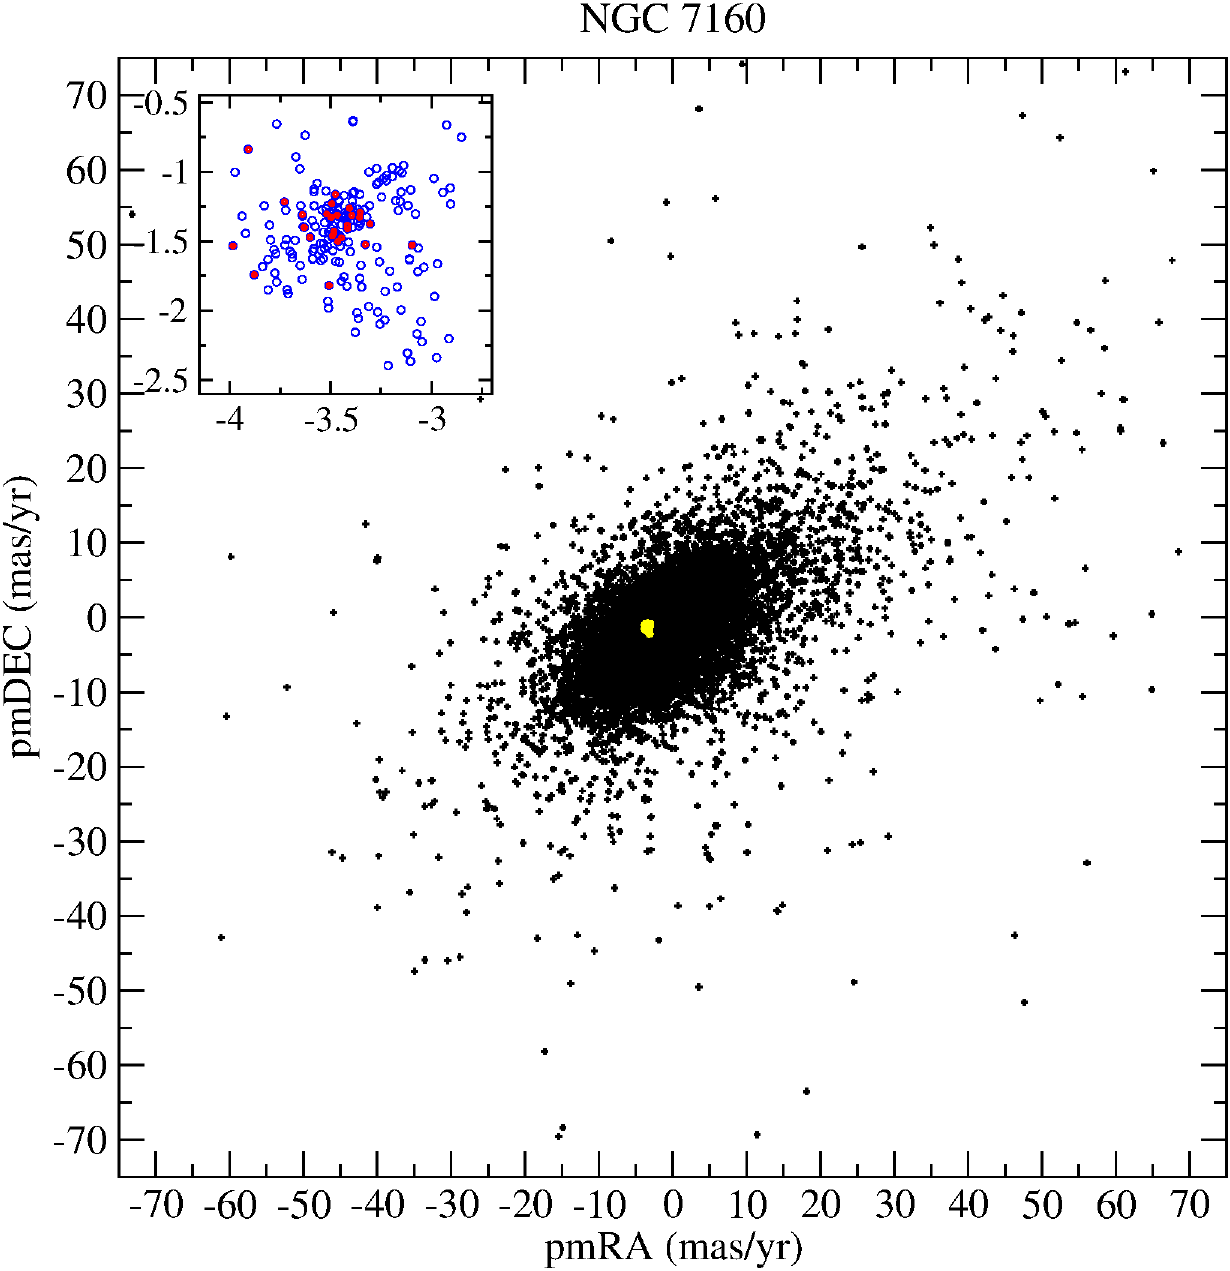
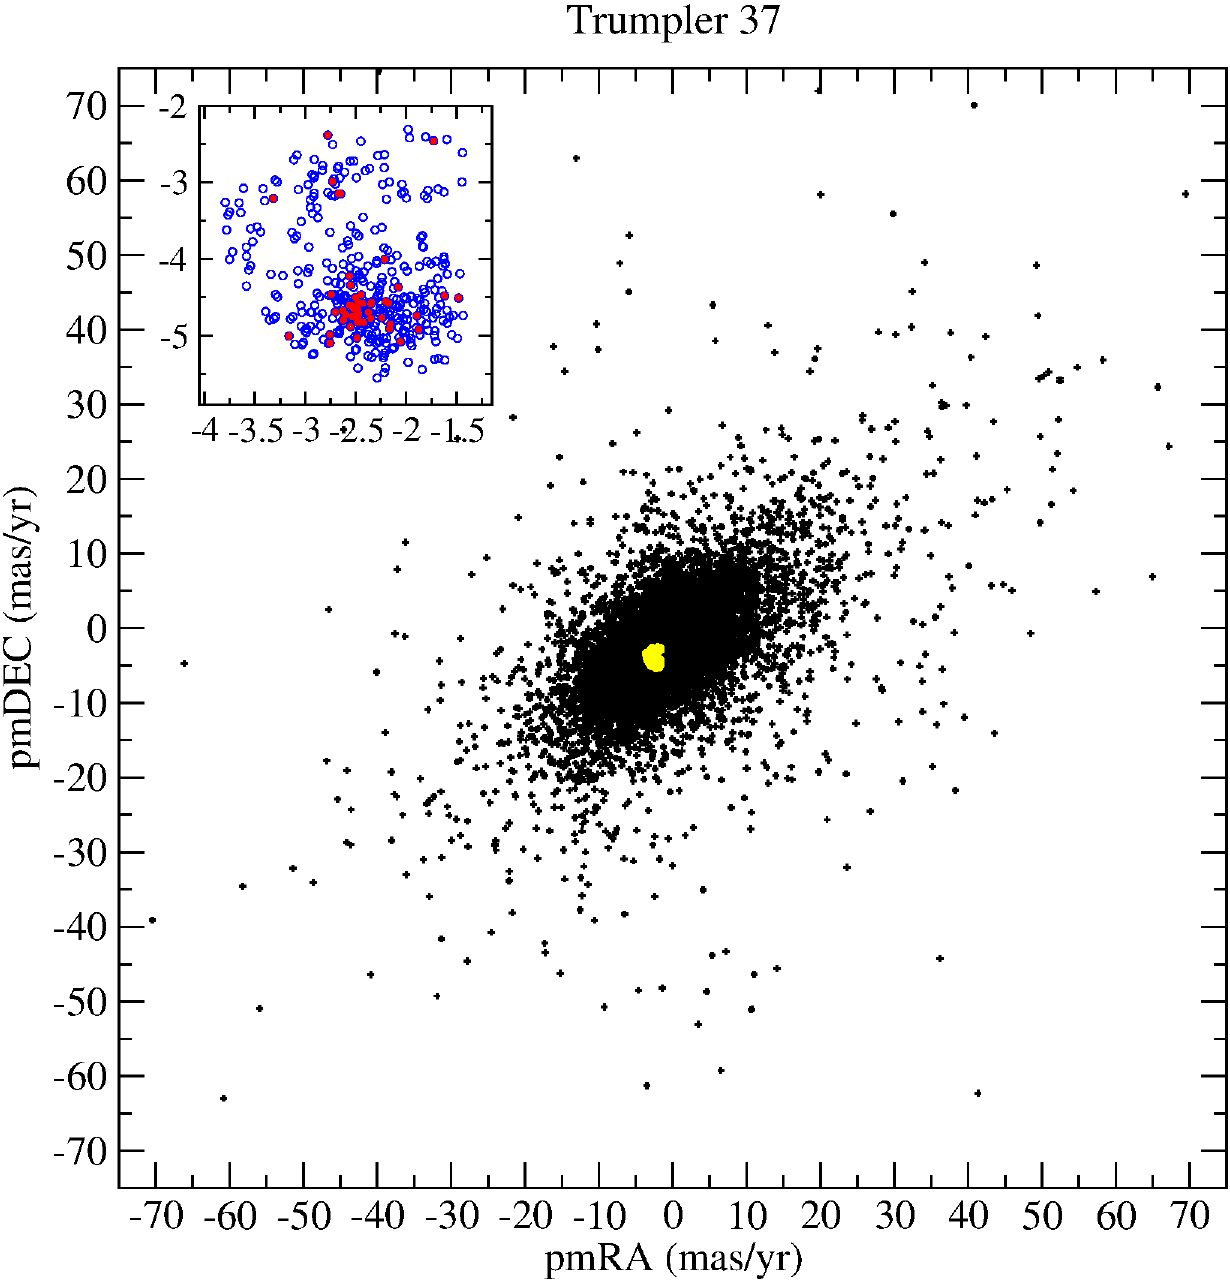
Fig. A.1.
Proper motion distributions for the different clusters where the field stars within FOV
20pc having absolute proper motions ≤ 75 mas yr
-1 and the member stars are indicated in black and yellow, respectively. The top left sub-panels focus on the proper motions of the members, where the blue and red circles correspond to those identified within FOV
20pc and FOV
2pc, respectively. Typical (mean) uncertainties in proper motions are ~ 0.04 mas yr
-1, roughly comparable to the size of such circles for most cases.
(You can click on each image to see a full size version).
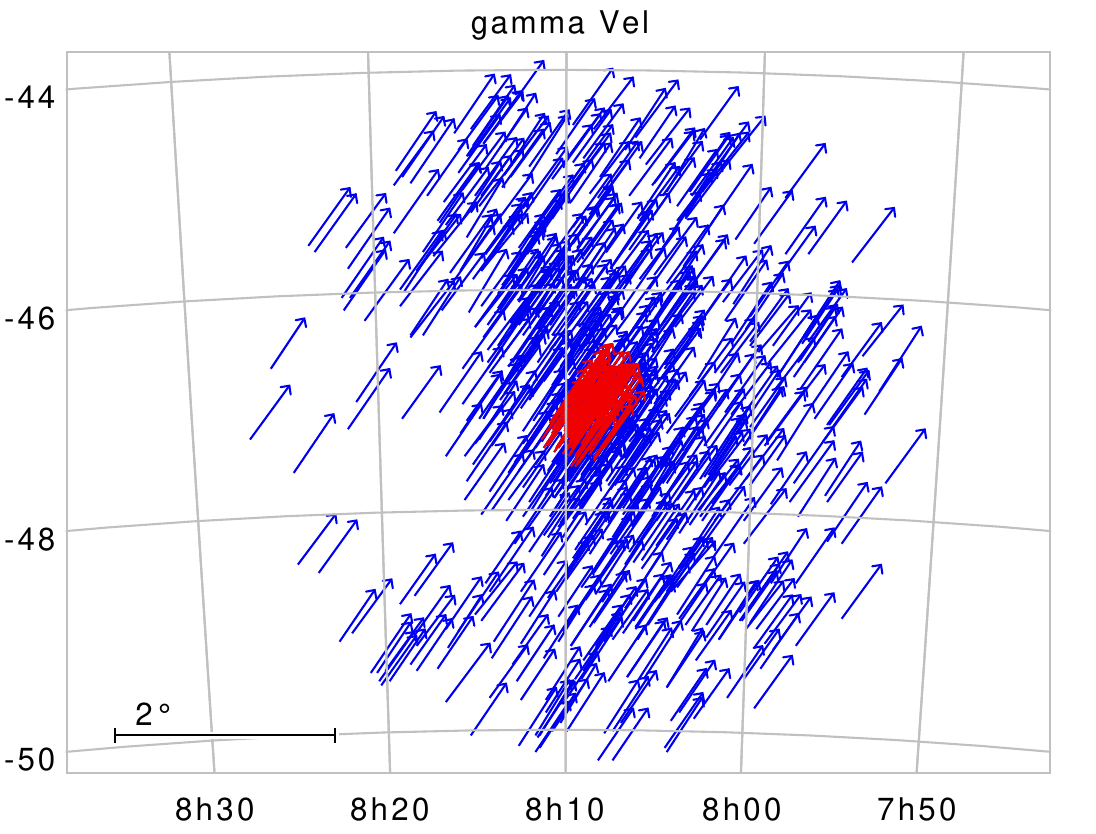
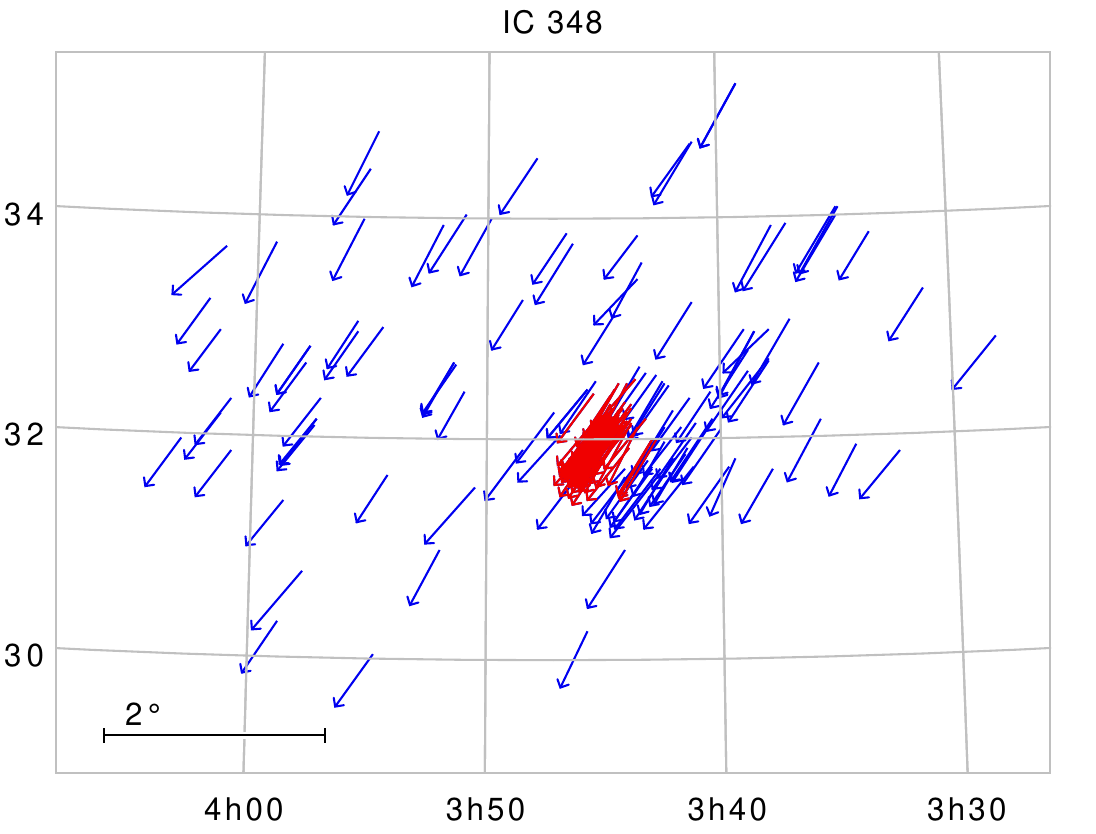
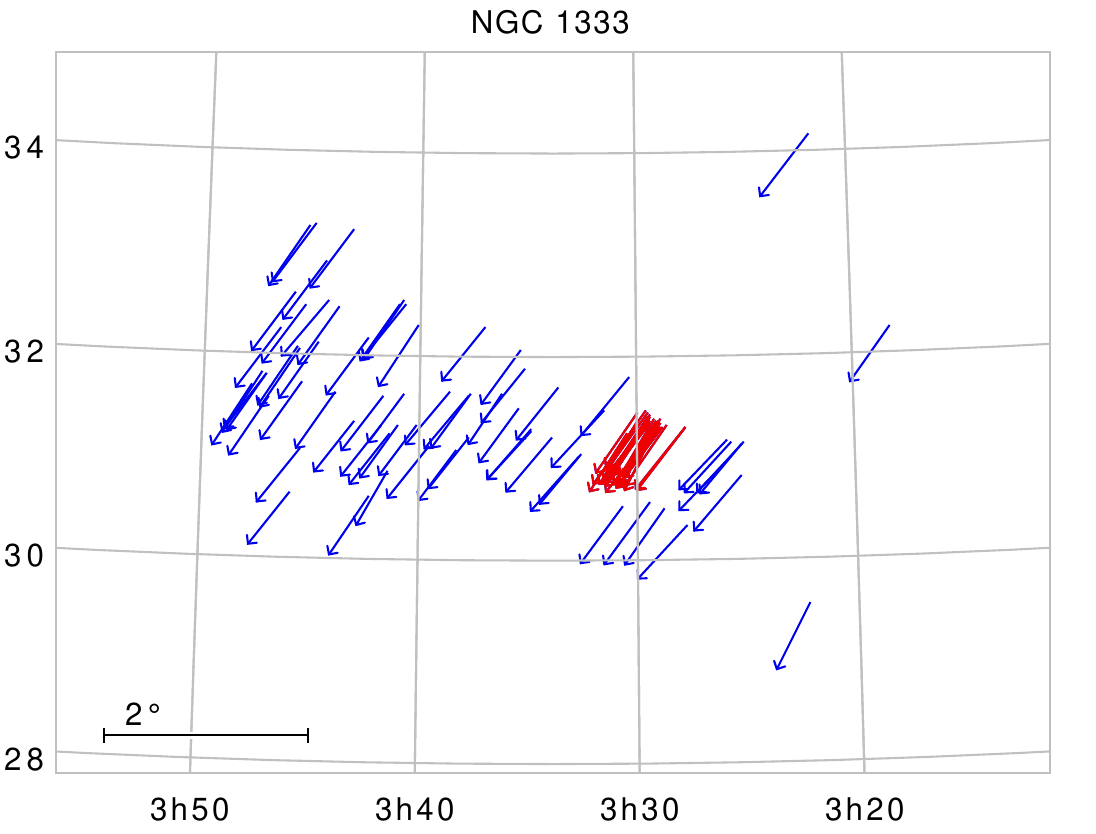
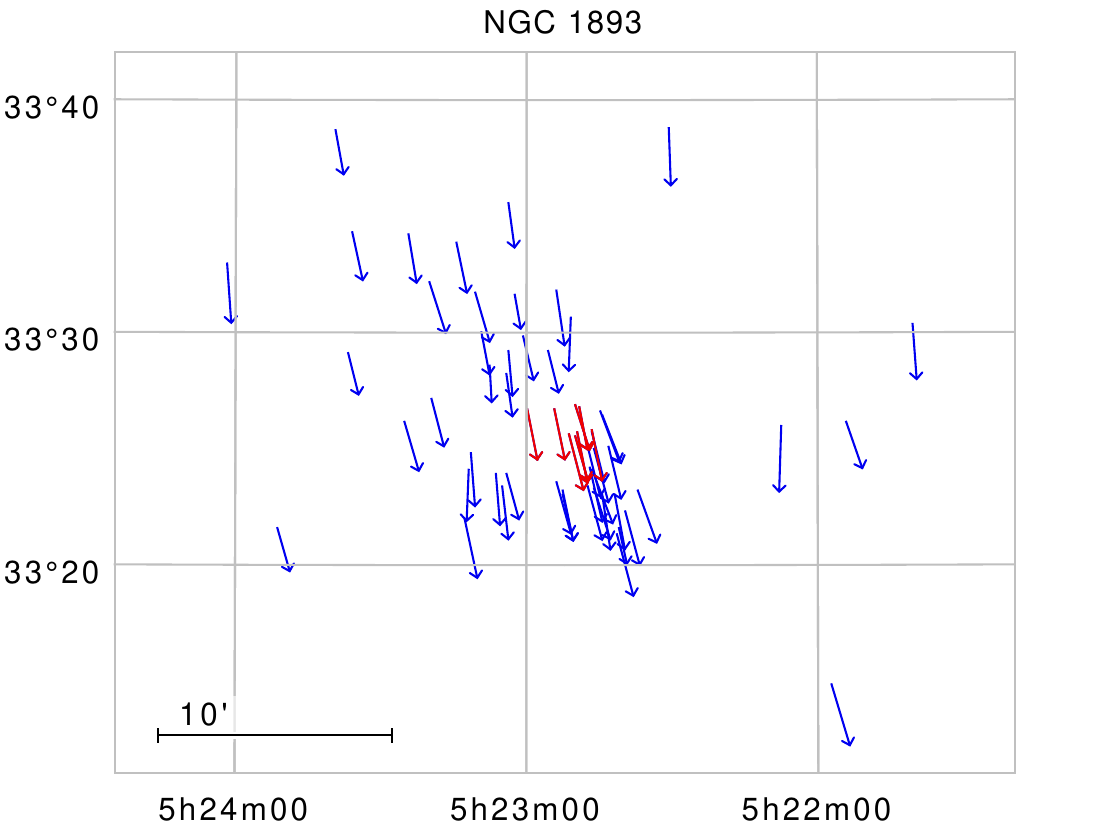
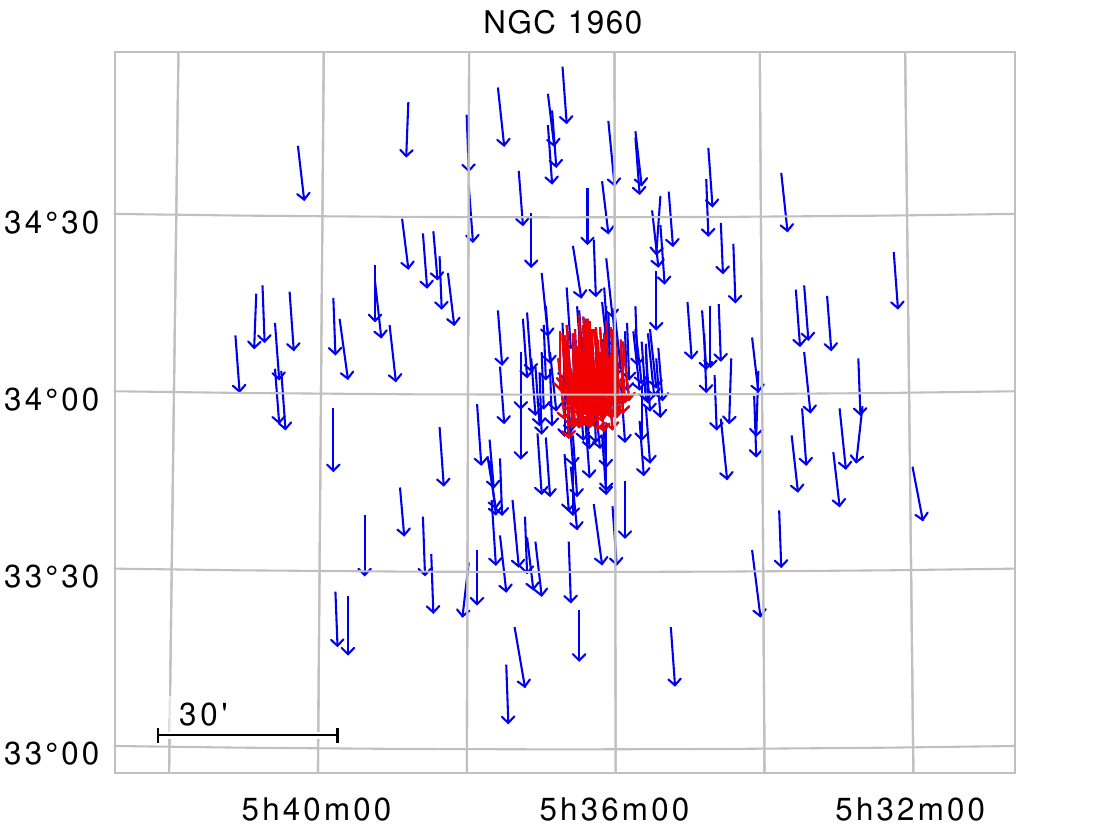
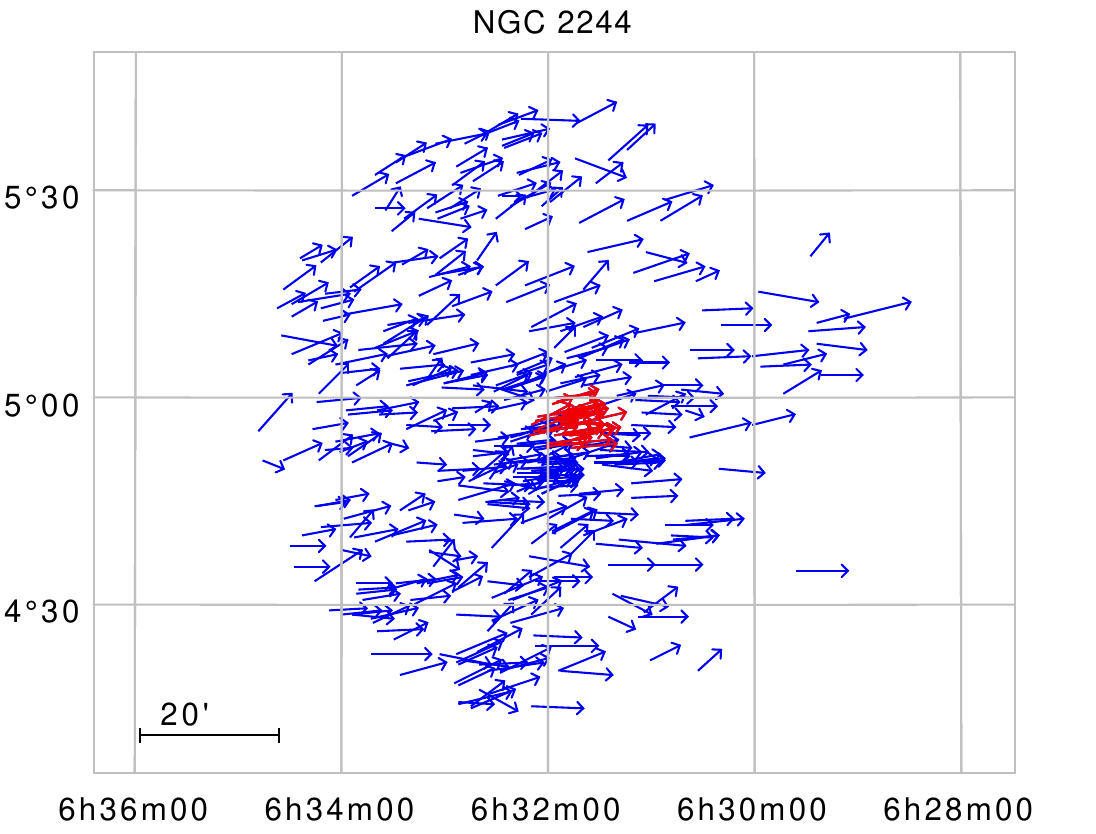
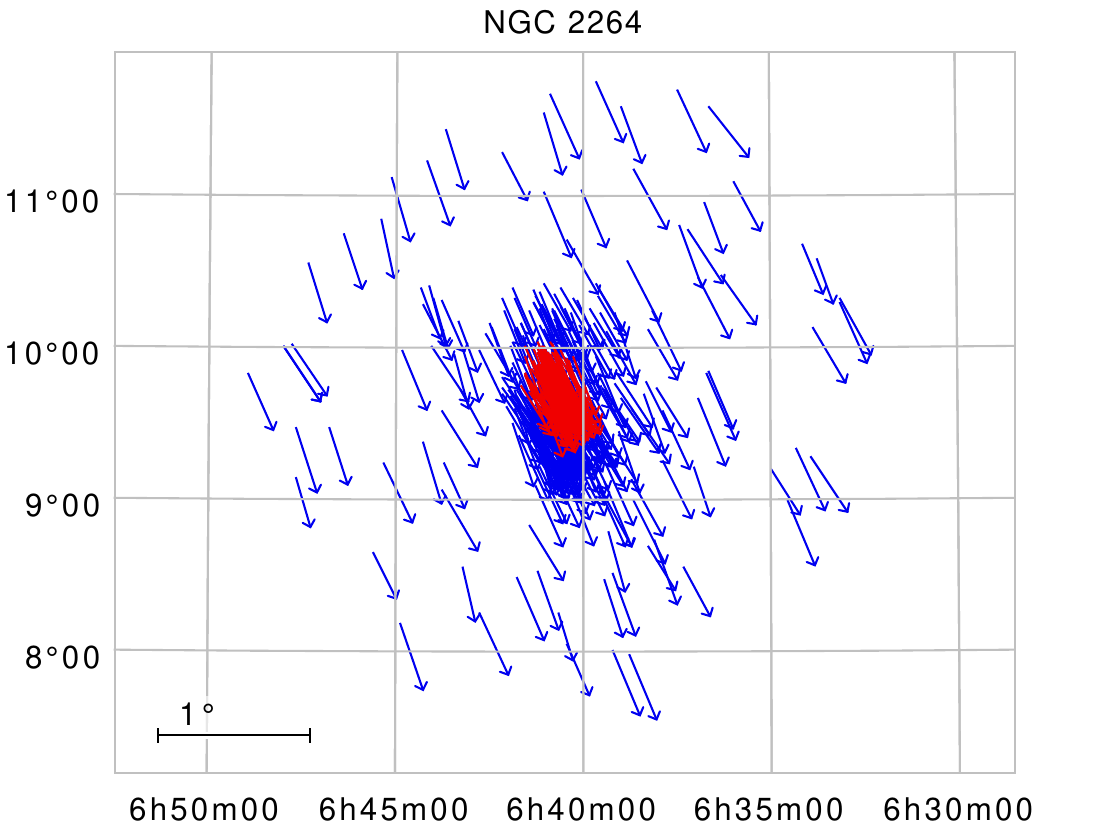
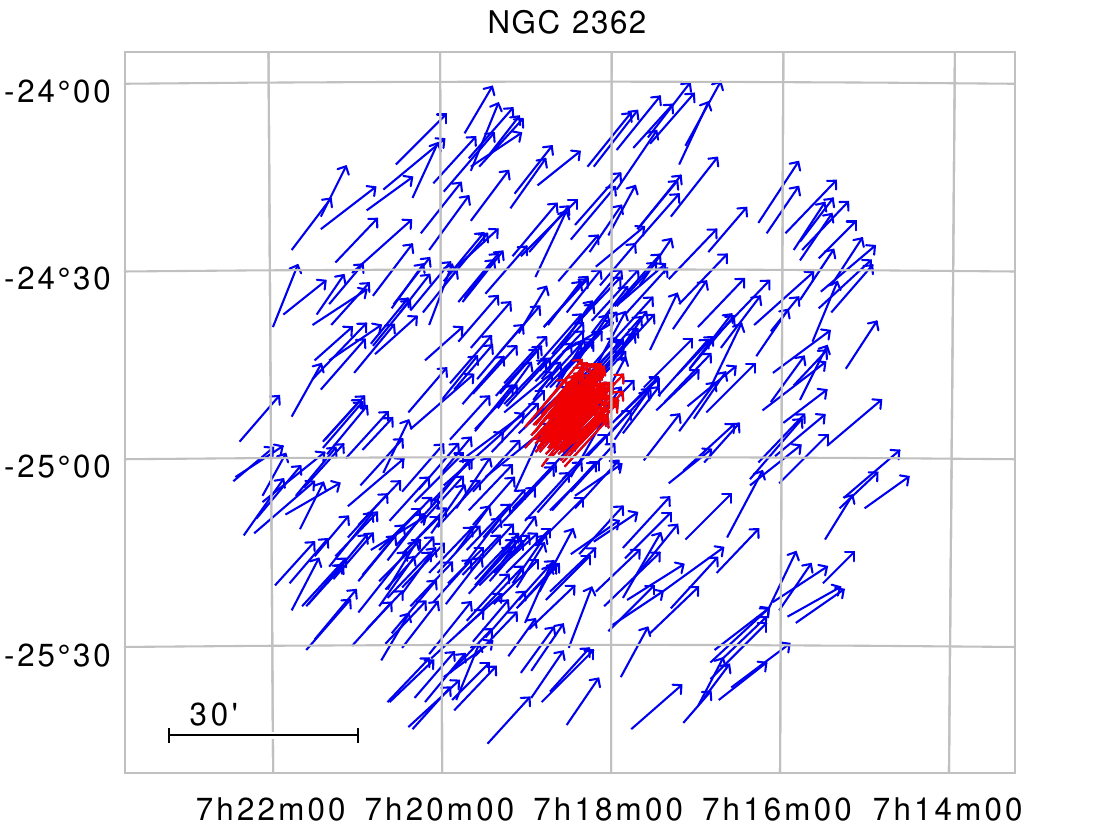
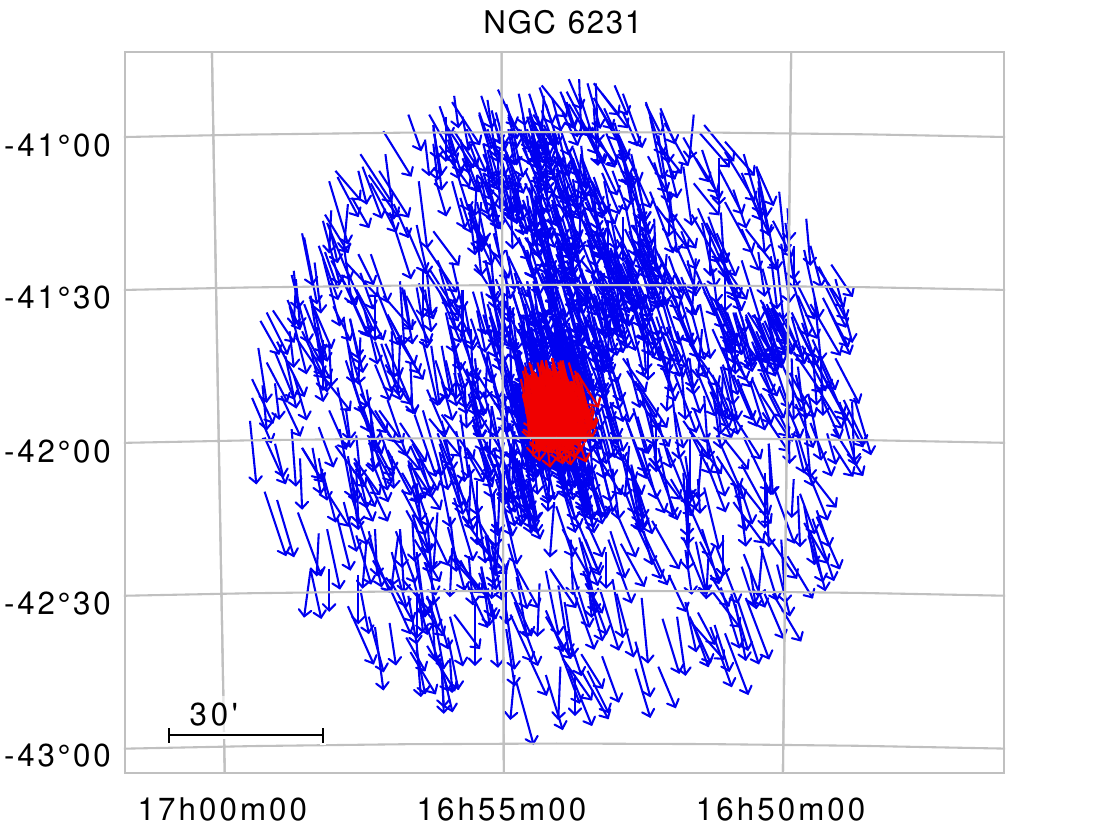
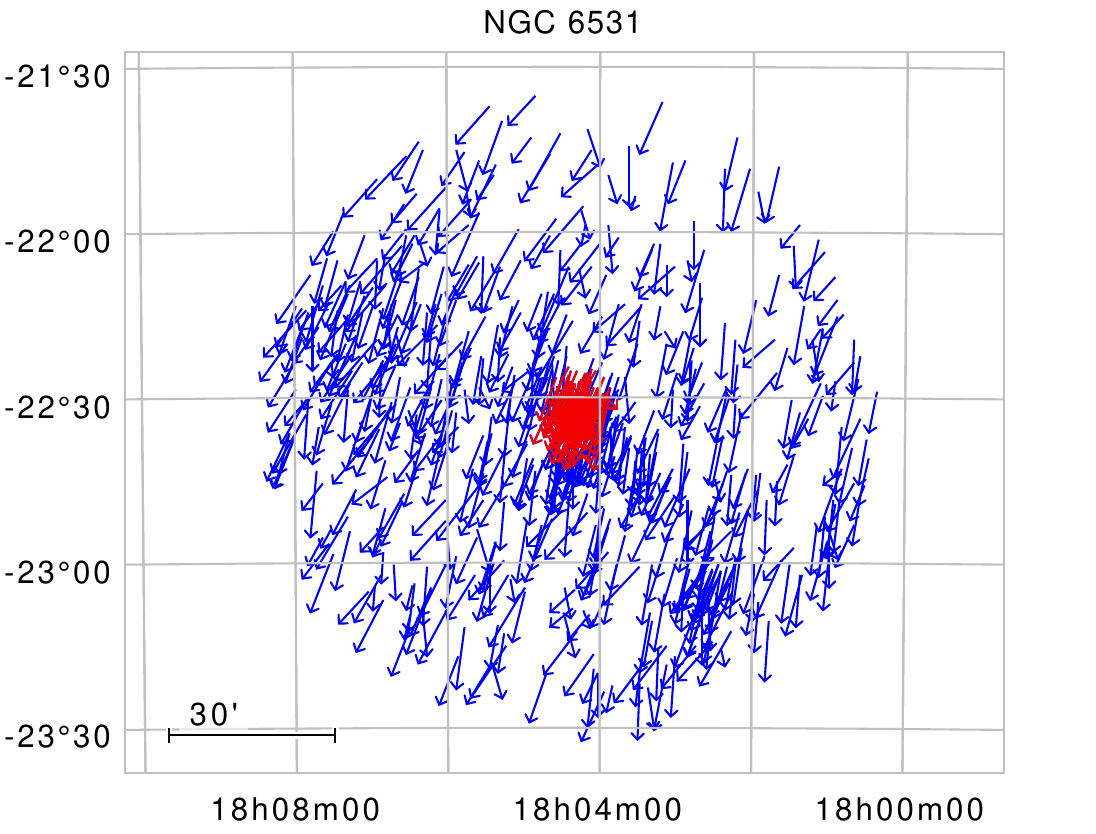
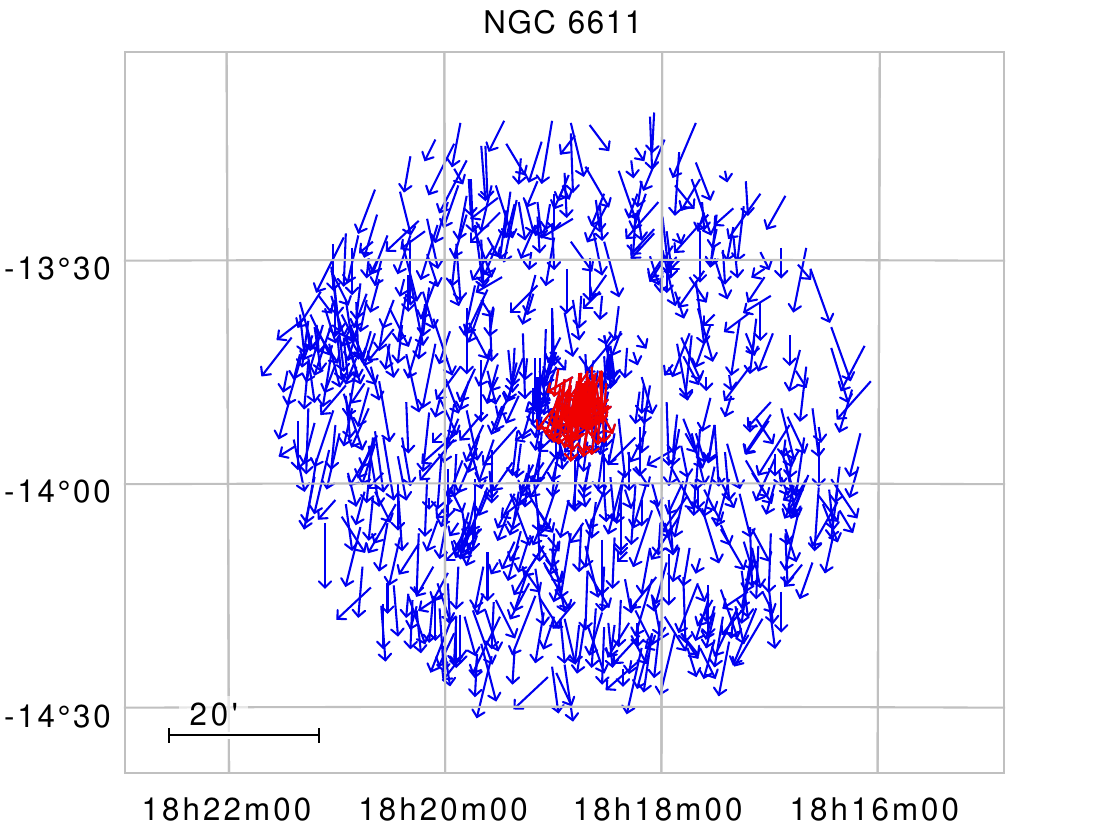
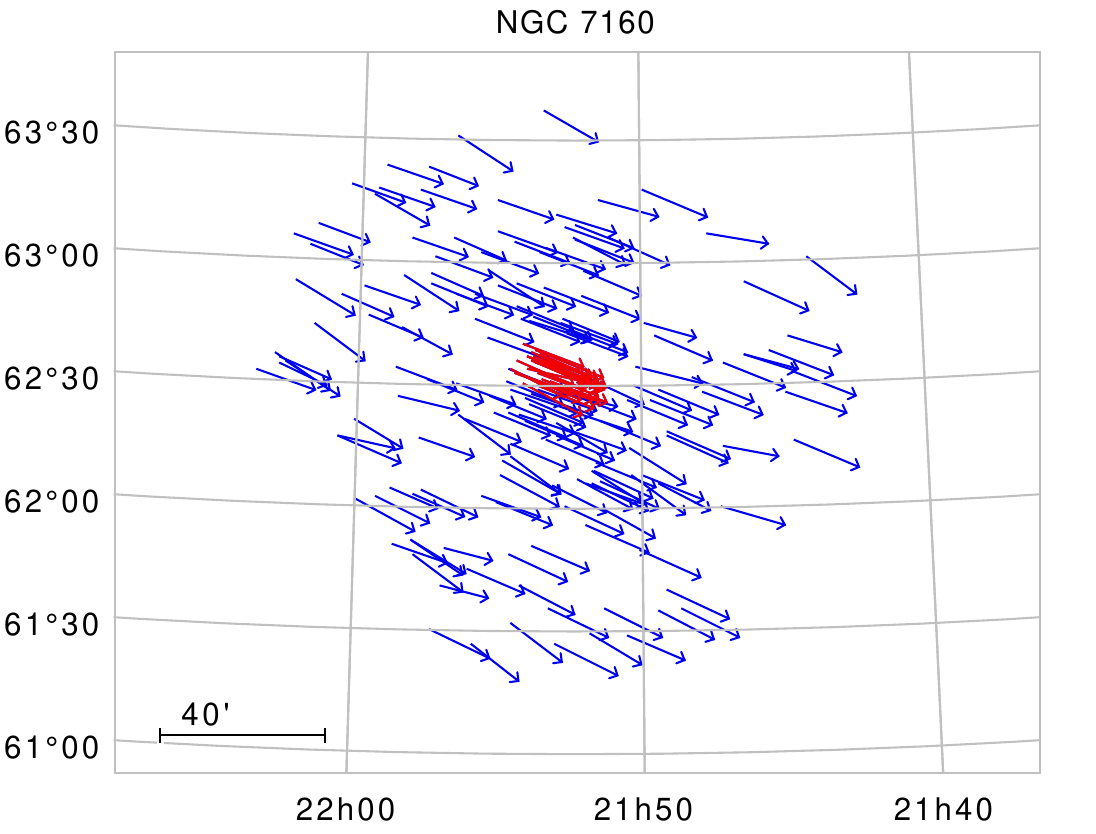
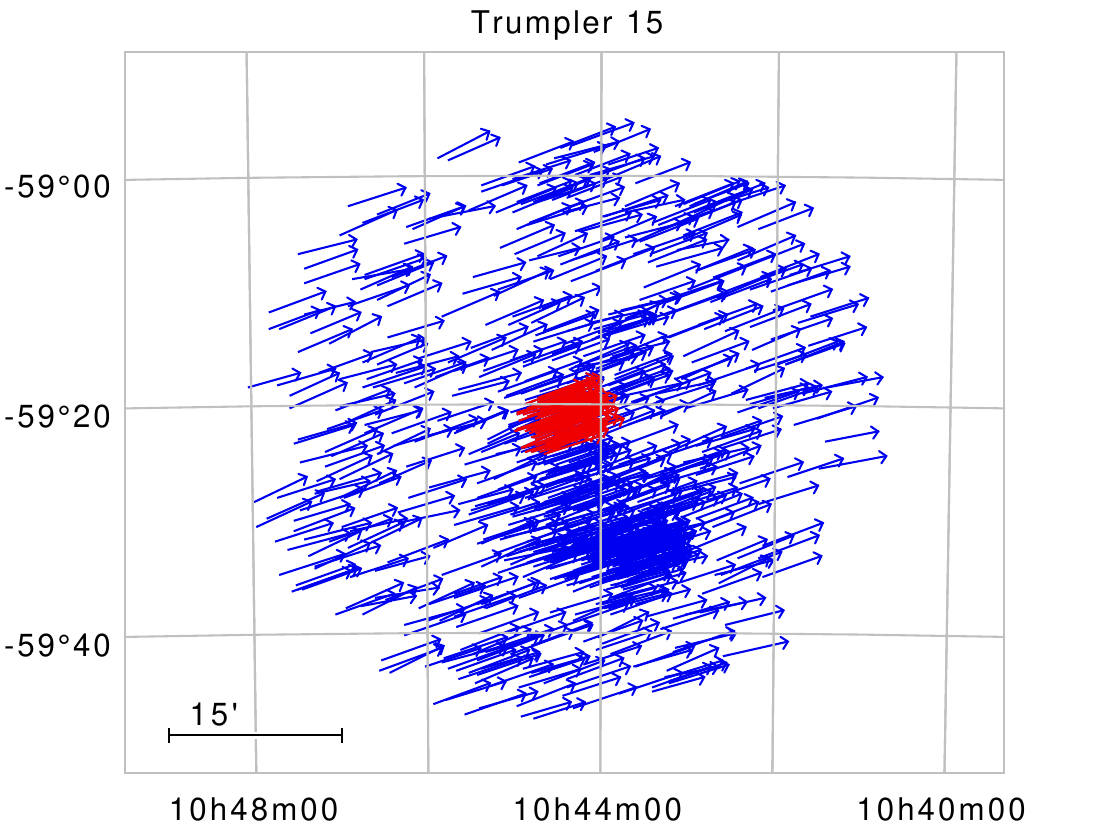
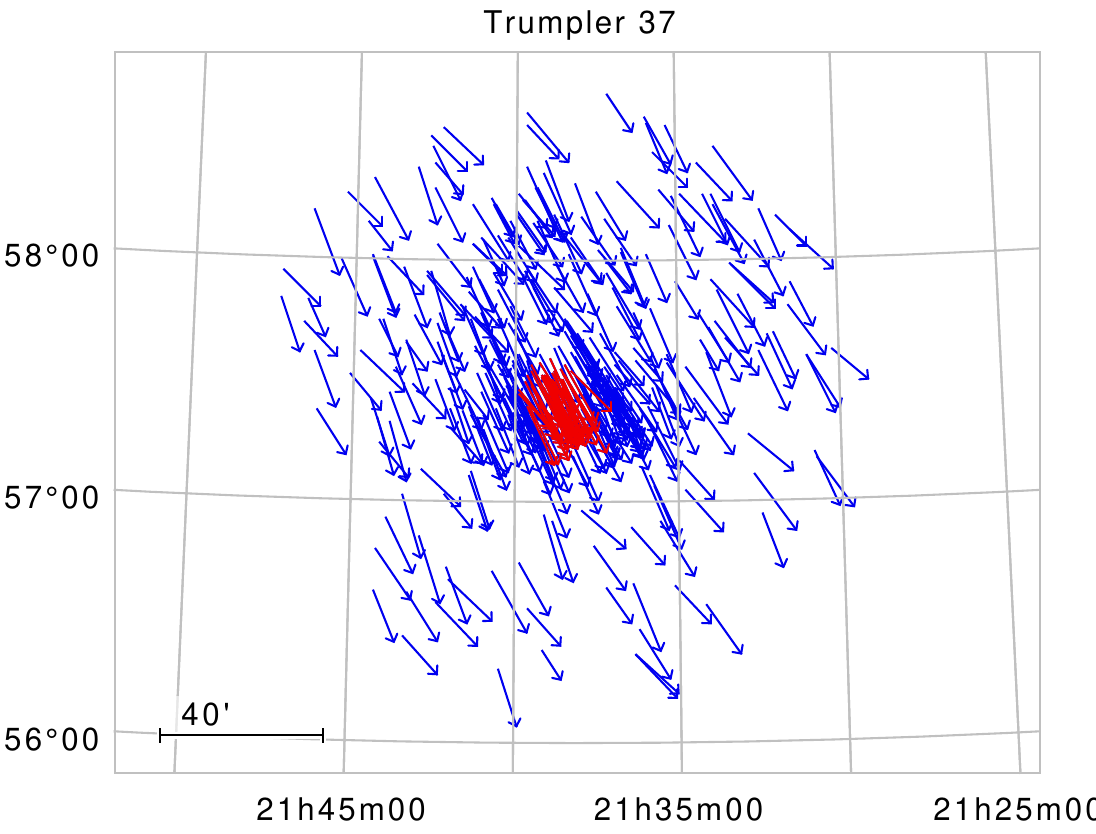
Fig. A.2.
Sky projections (North to the top and East to the left) for the different clusters where the blue and red arrows indicate the
directions of motion of all members identified within FOV
20pc and FOV
2pc, respectively.
(You can click on each image to see a full size version).
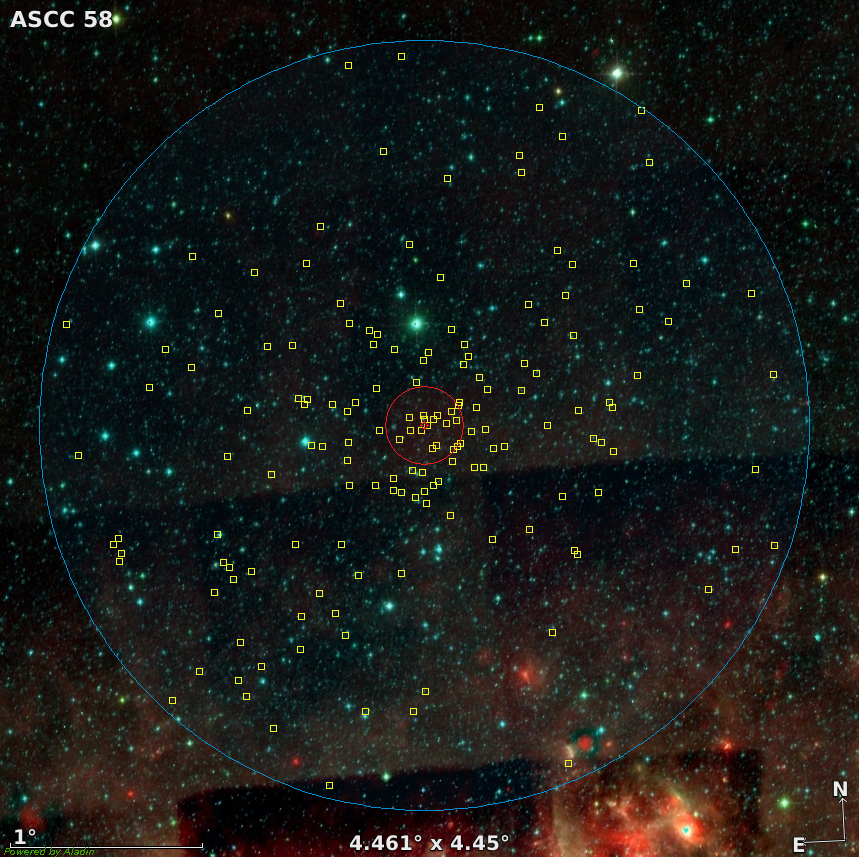
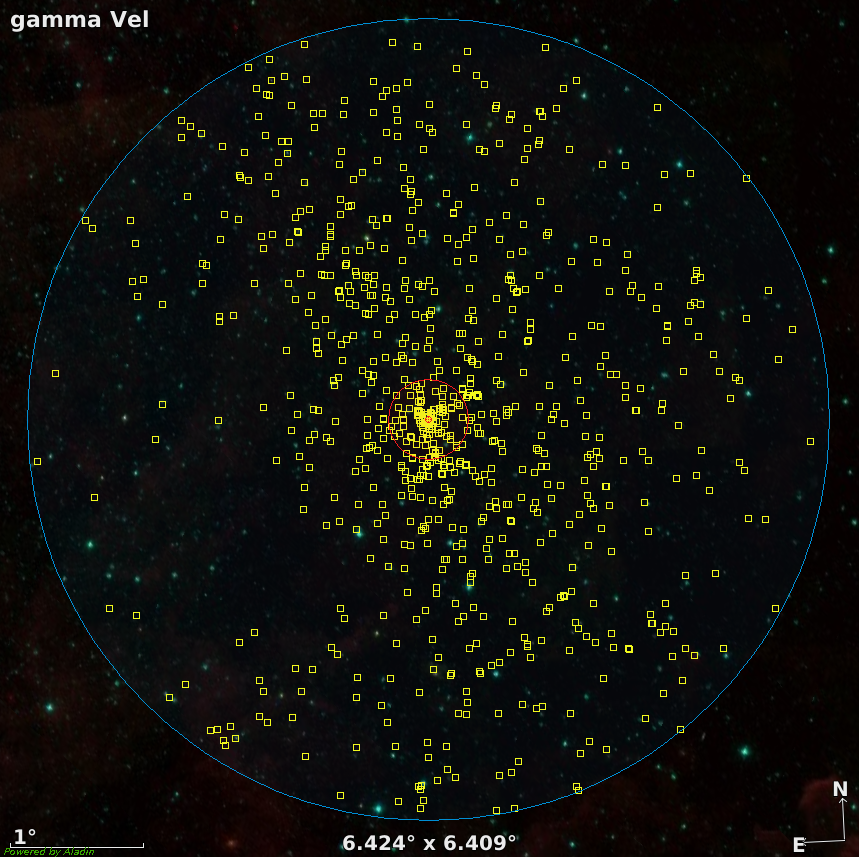
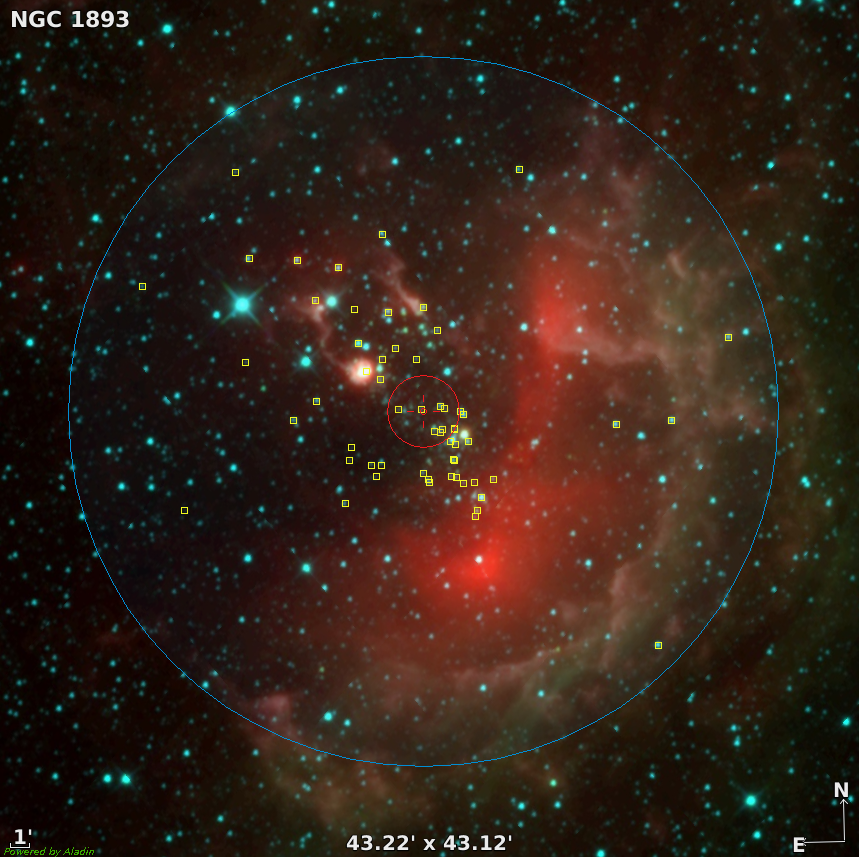
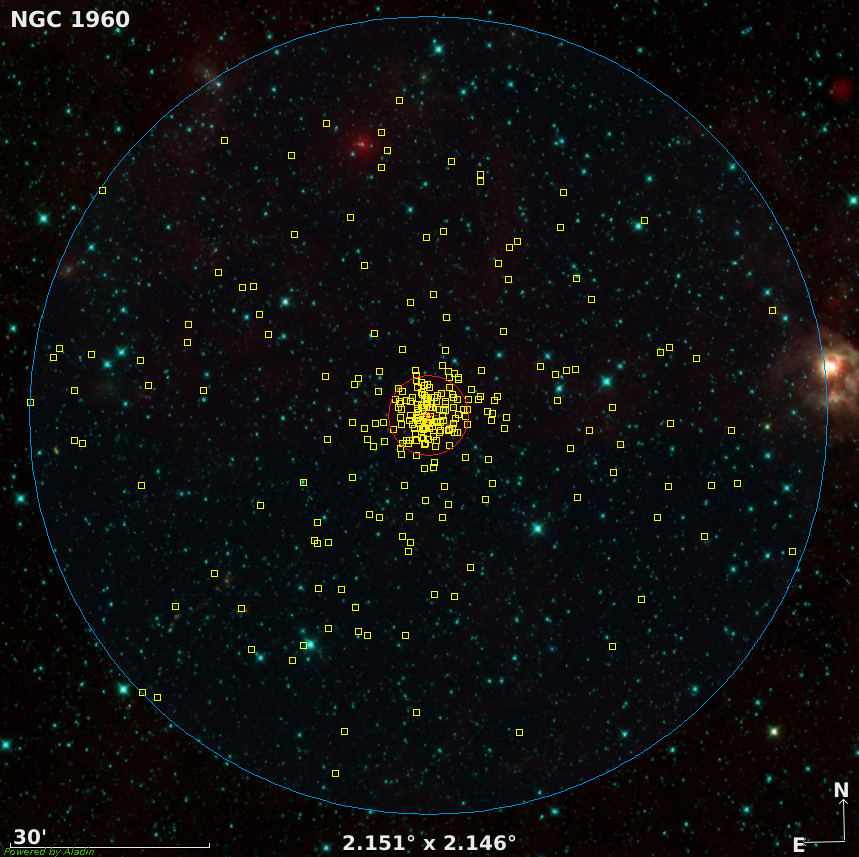
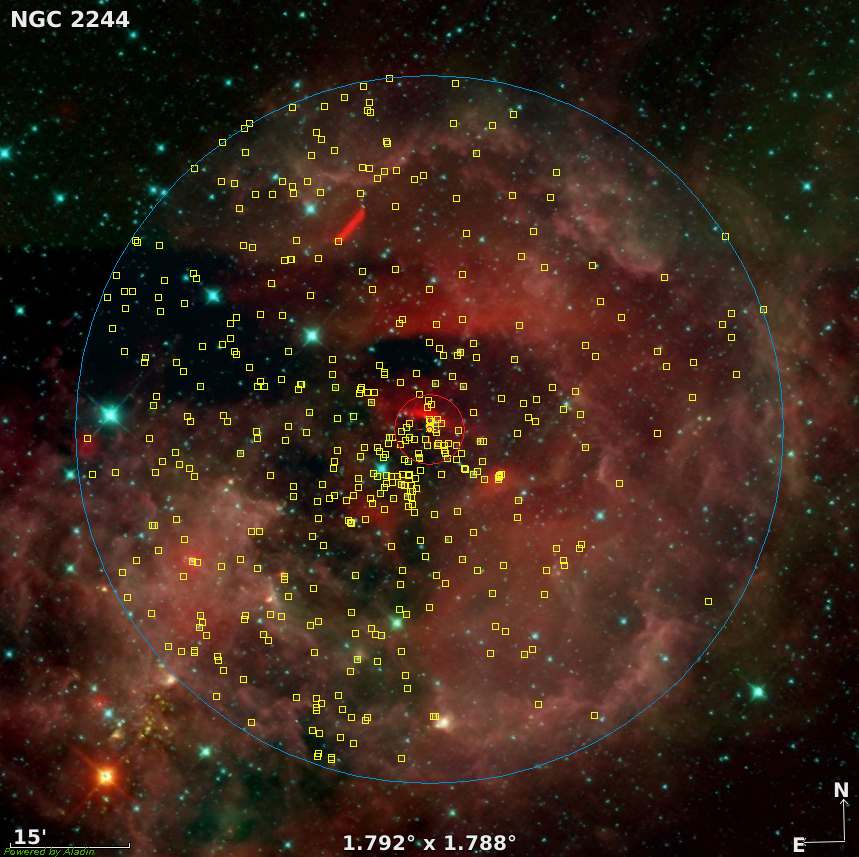
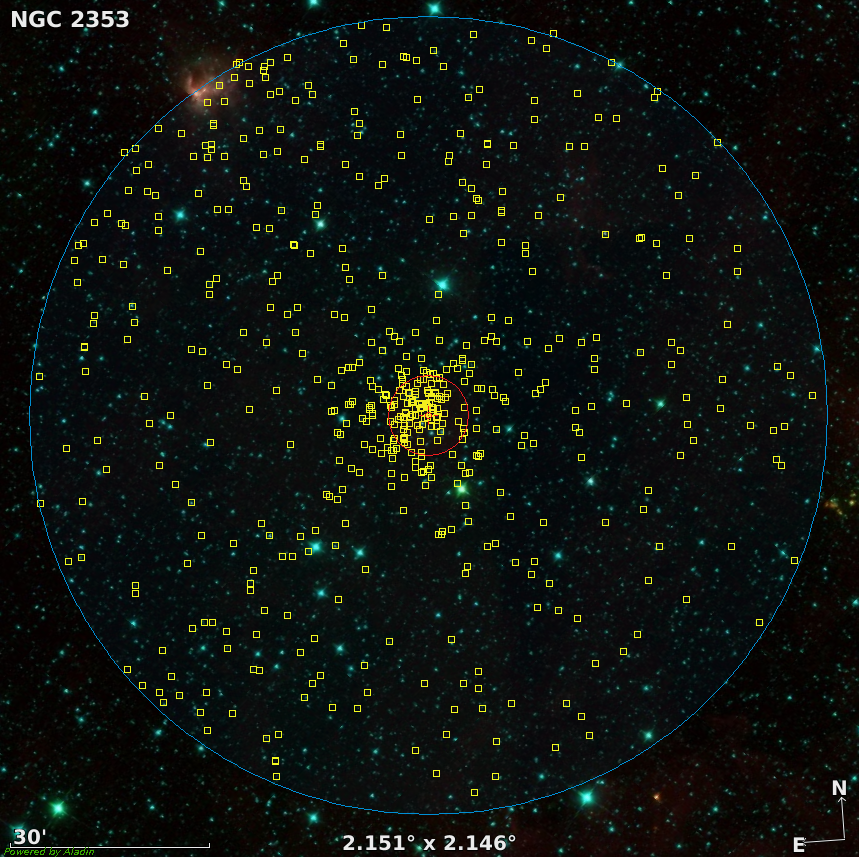
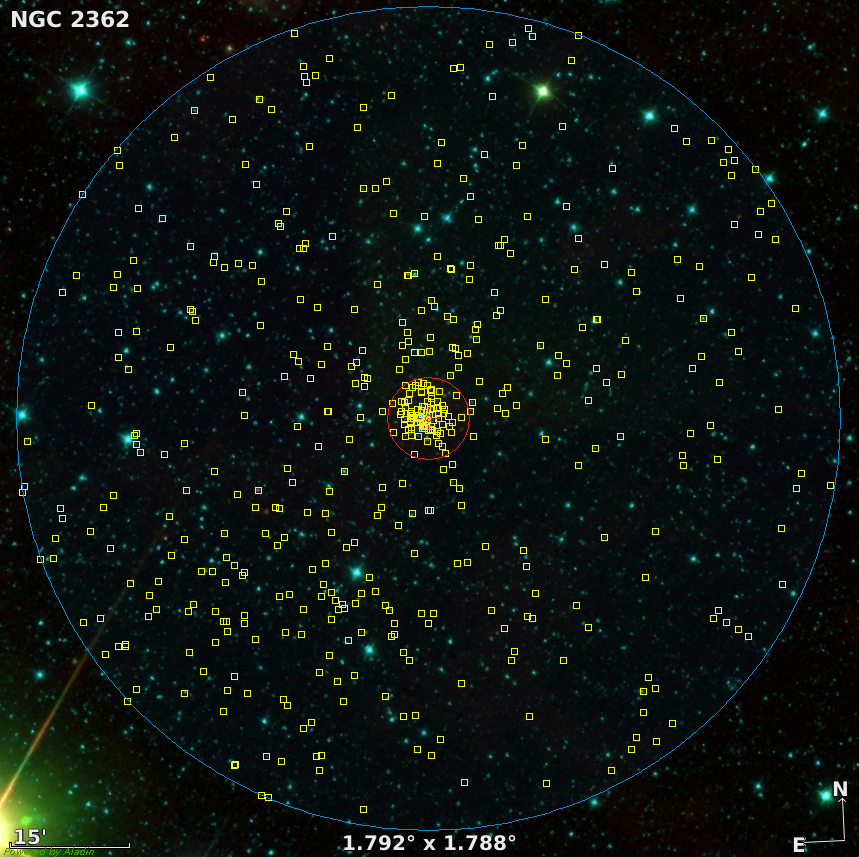
Fig. A.3.
Sky projections for the different clusters where the yellow squares indicate the positions of all members identified within
FOV
20pc and FOV
2pc, whose corresponding sizes are indicated with the blue and red circles, respectively. Background images are
colored according to the ALLWISE W1, W2, and W4 bands (except for Trumpler 15, NGC 6231, NGC 6531, and NGC 6611,
where 2MASS images are used for a better visualization).
(You can click on each image to see a full size version).
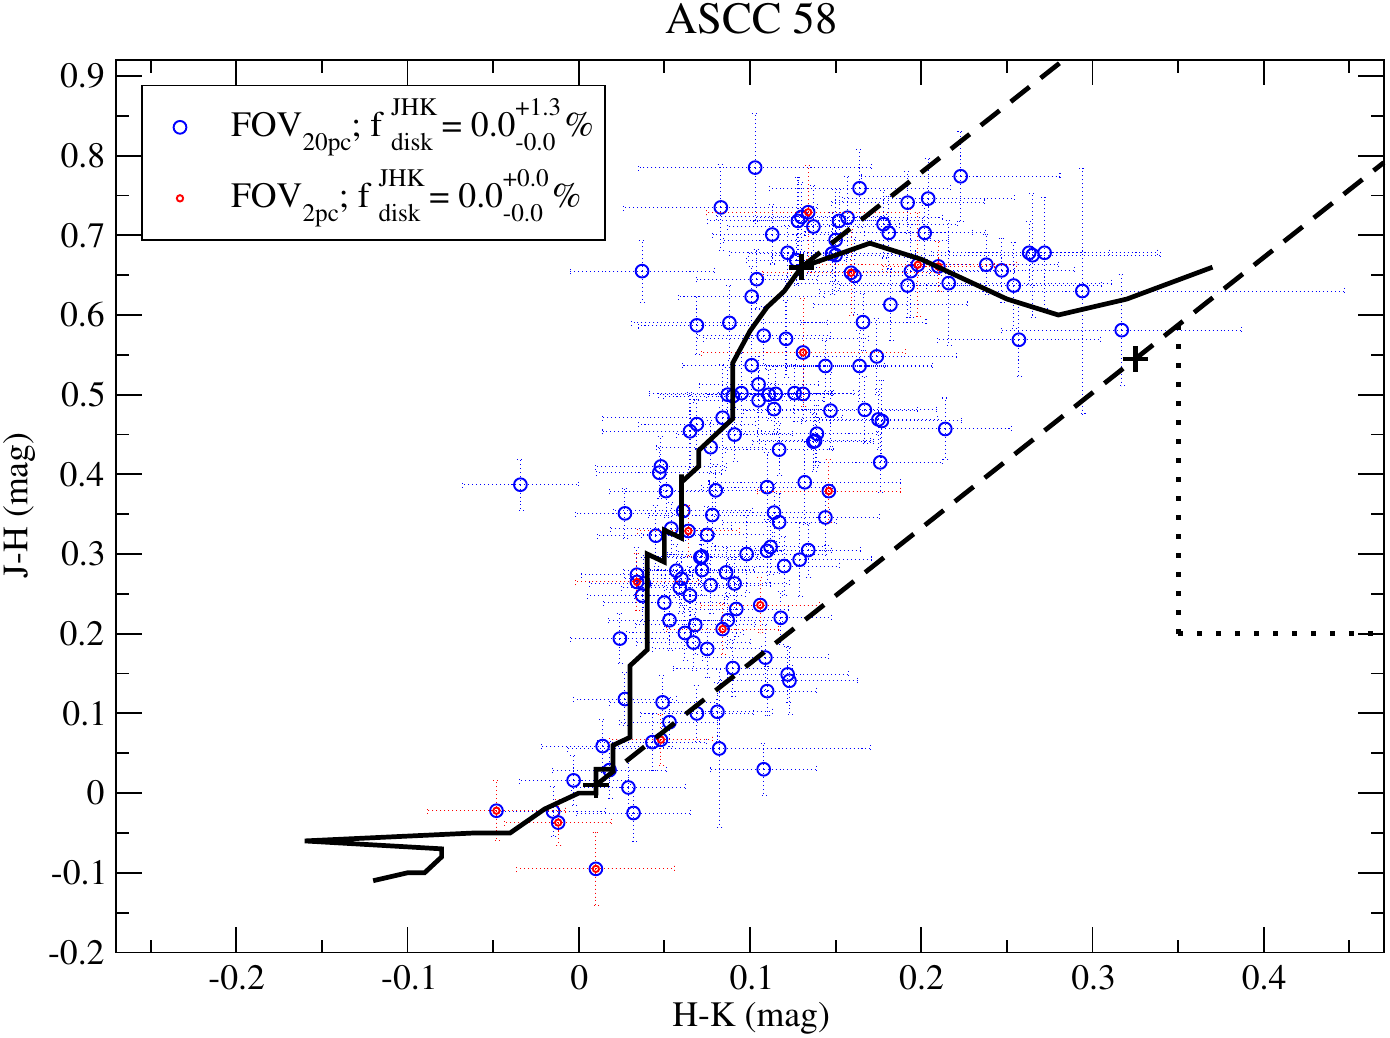
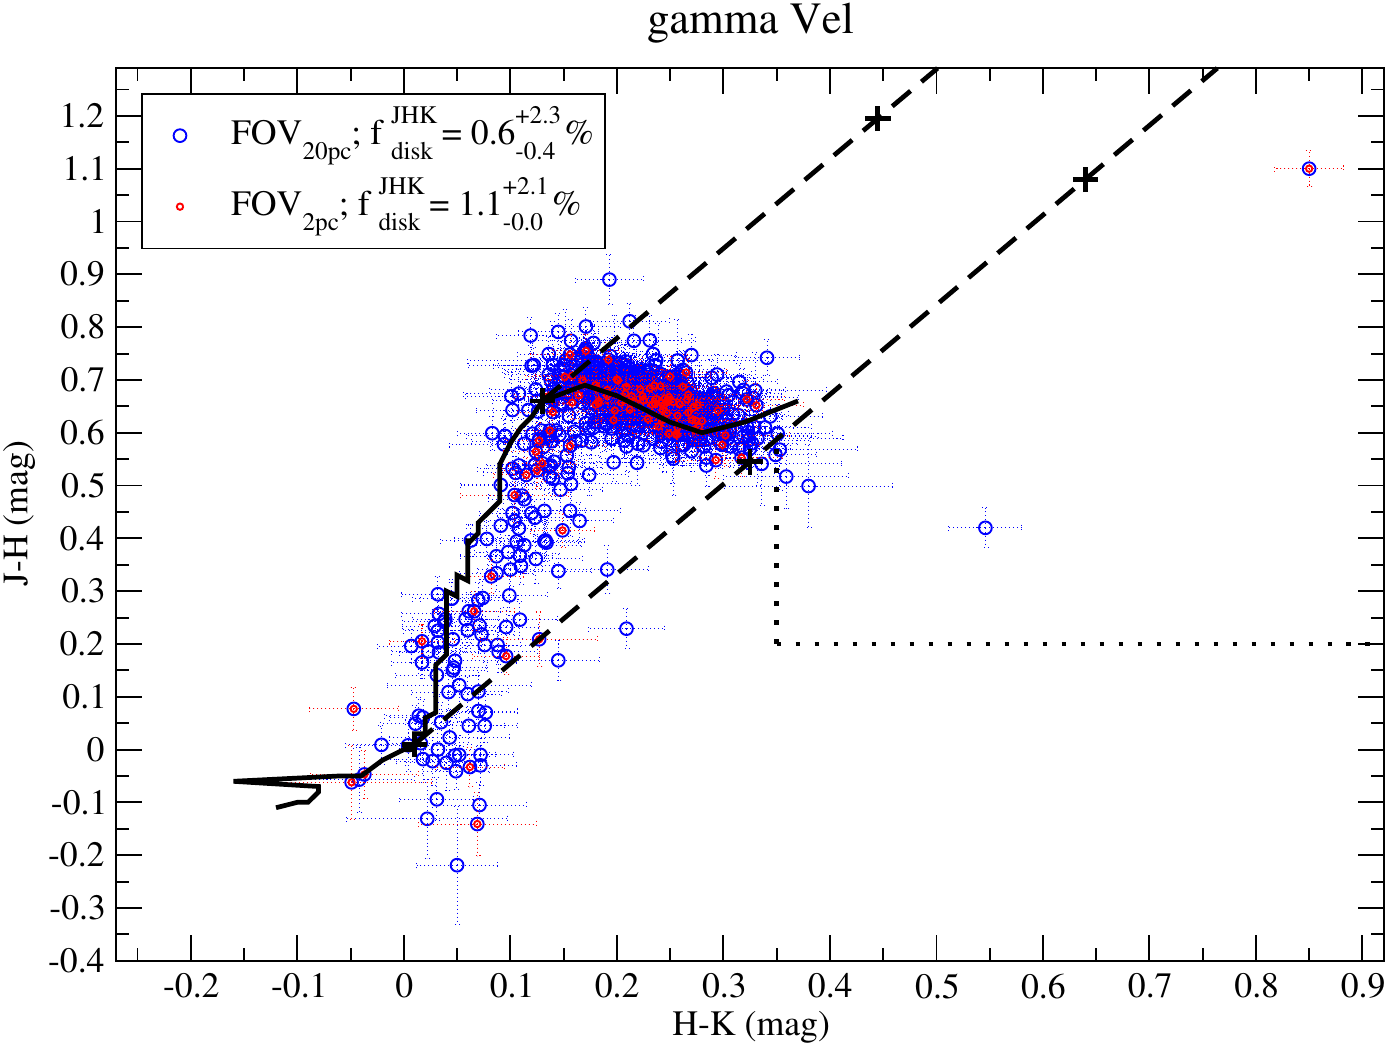
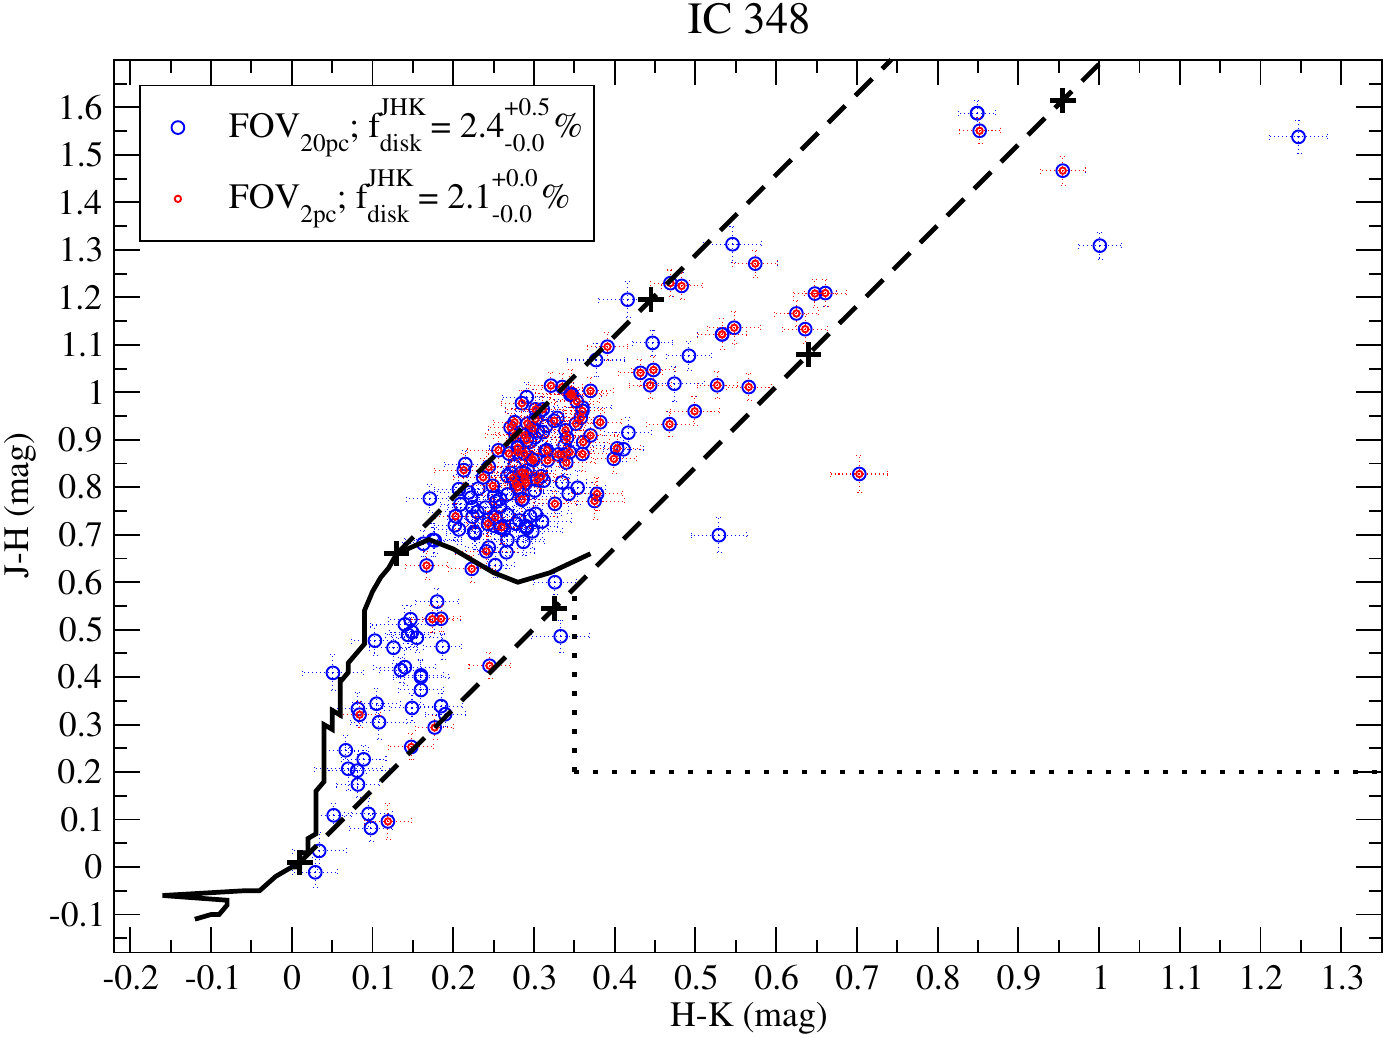
Fig. A.4.
JHK color-color diagrams for the different clusters. In each panel, the solid line represents the expected position of non-
extincted MS stars in the diagram, and the dashed lines the direction of the extinction vector and thus the rough boundaries for
extincted MS stars (crosses within the dashed lines indicate an optical extinction increase of 5 magnitudes). Sources located to the
right of the right hand dashed lines and within the dotted lines are considered disk stars. Inner disk fractions are indicated in the legends,
as inferred from all identified members within FOV
20pc and within FOV
2pc (blue and red symbols, respectively).
(You can click on each image to see a full size version).
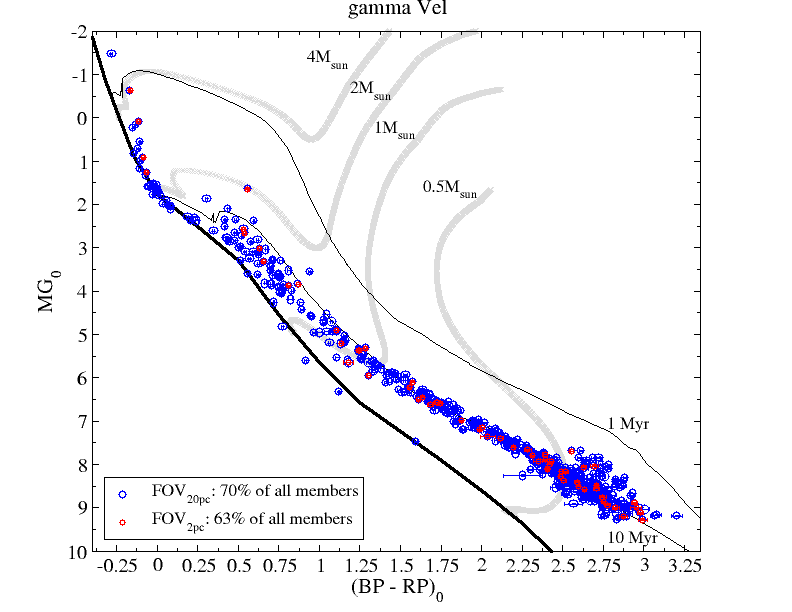
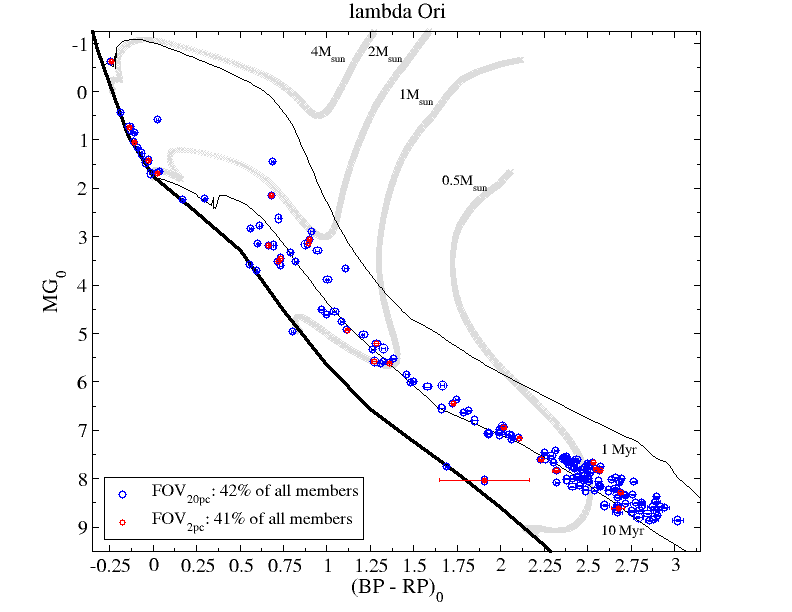
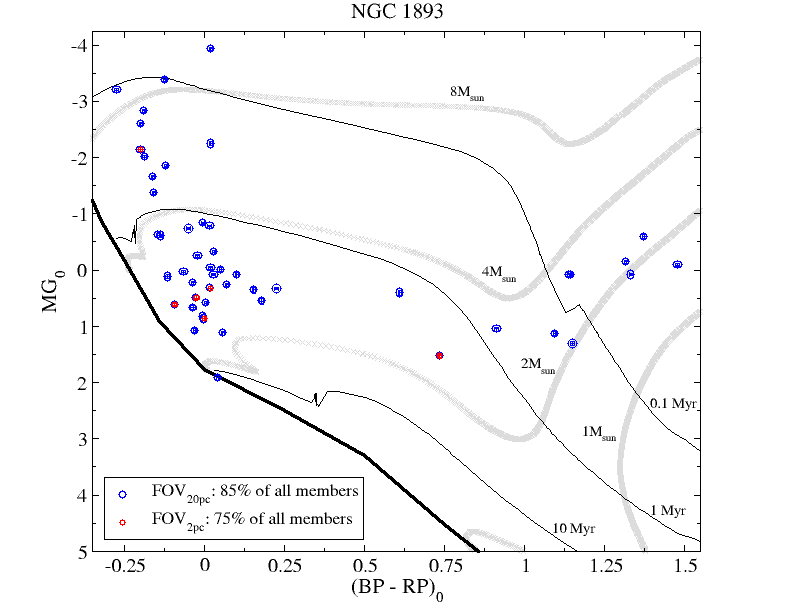
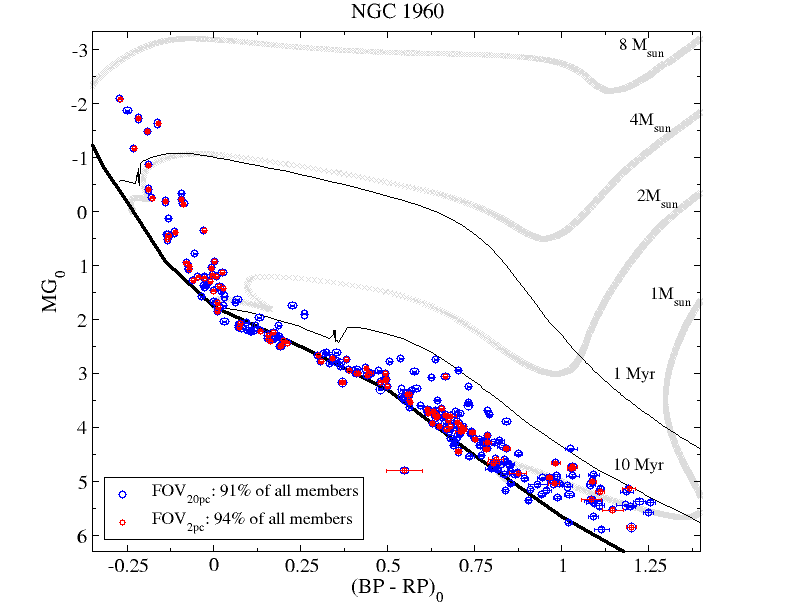
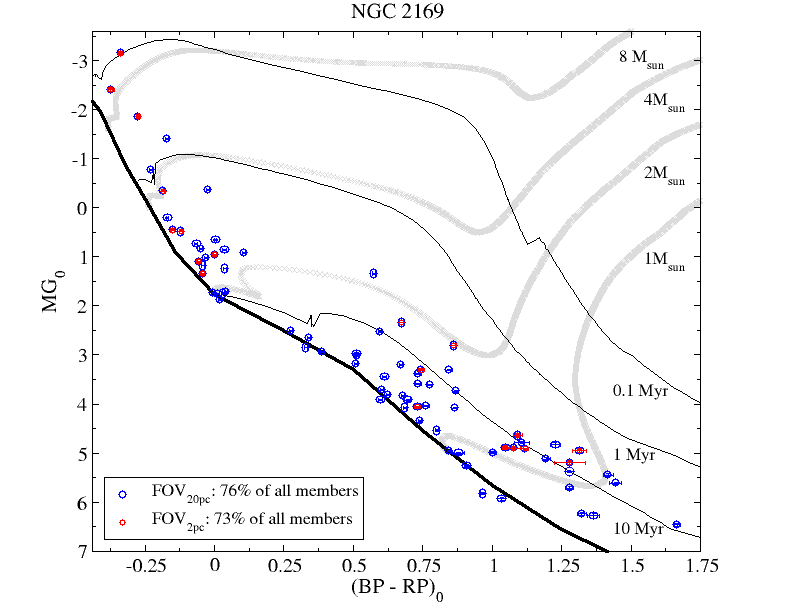
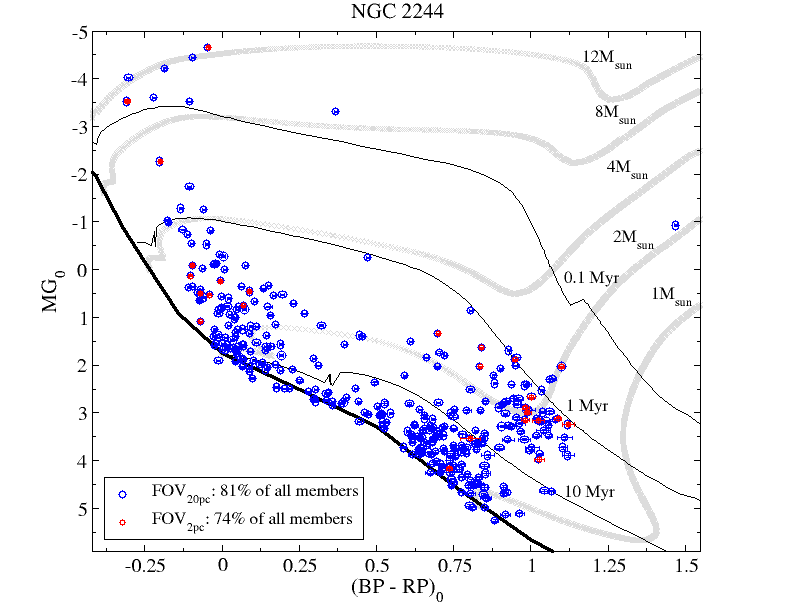
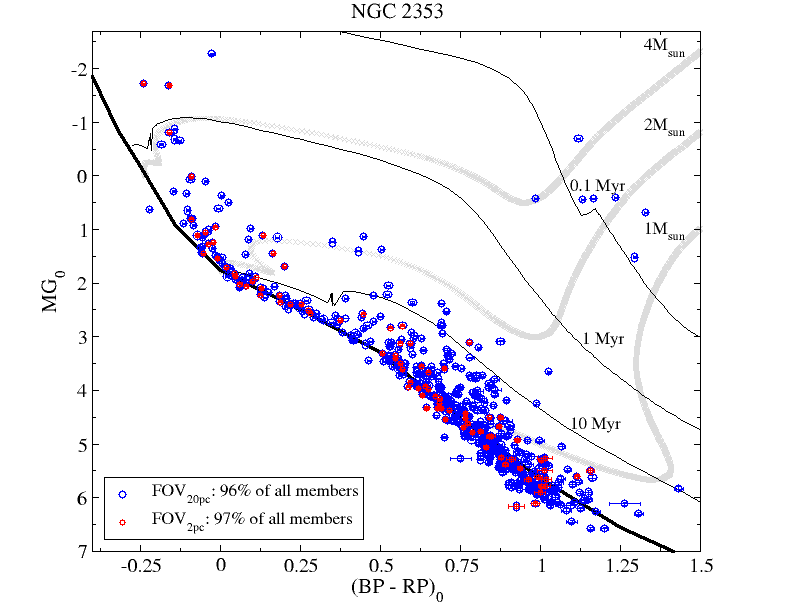
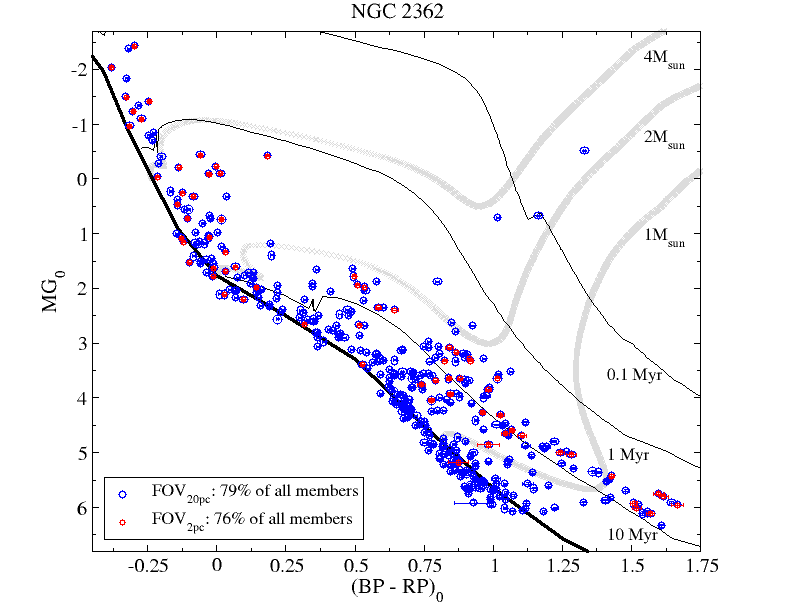
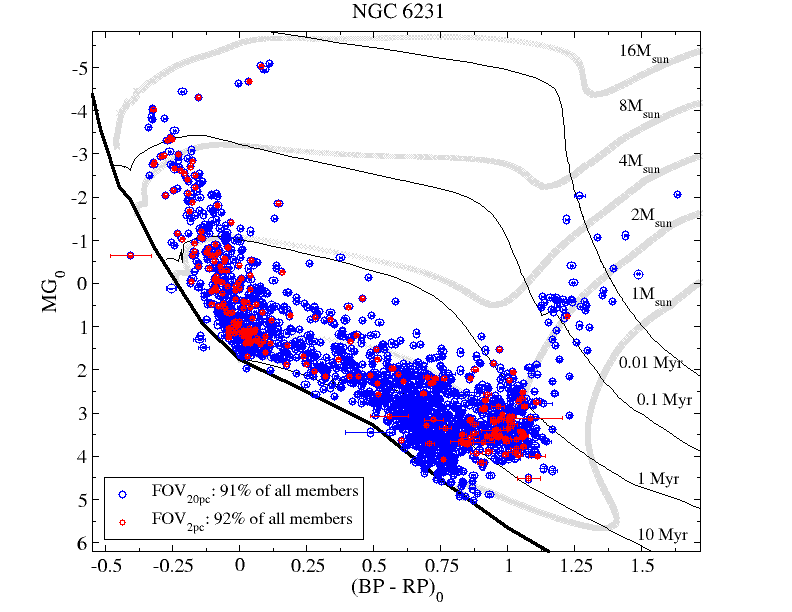
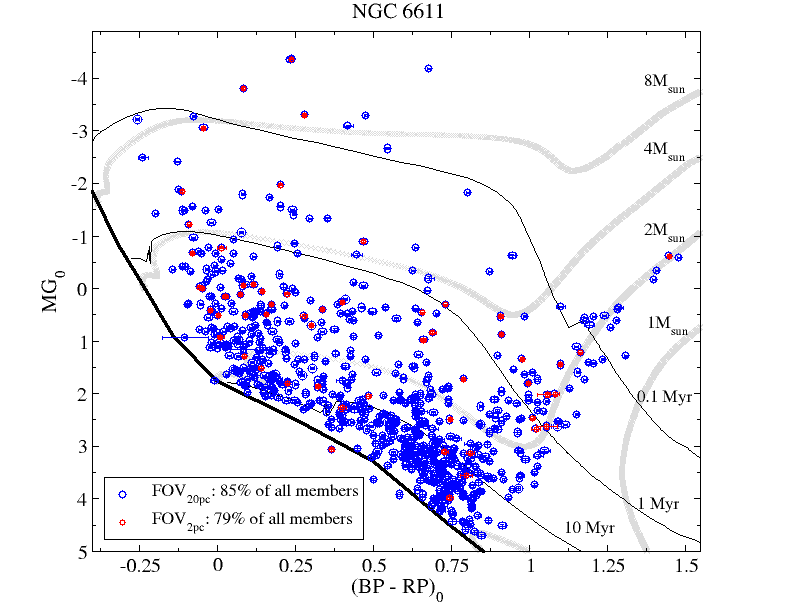
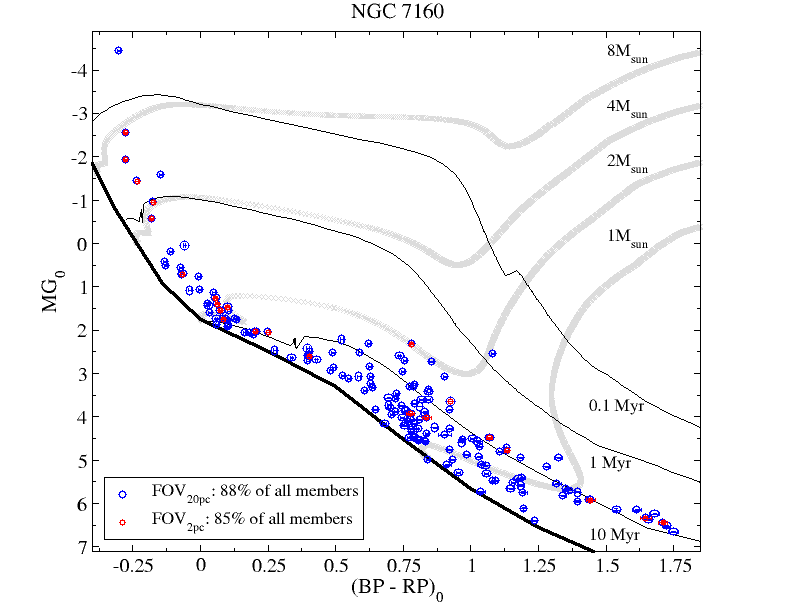
Fig. A.5.
Extinction corrected Gaia CMDs for the different clusters. The ZAMS loci is indicated with the black solid curve.
PMS isochrones and evolutionary tracks from (Bressan et al. 2012) are overplotted in black and gray for the stellar ages and
masses indicated. The representativeness of the diagrams is limited to the fraction of all members identified within FOV
20pc
and FOV
2pc having optical extinction estimates in Anders et al. (2022), which is indicated in the legends.
(You can click on each image to see a full size version).